| GISdevelopment.net ---> AARS ---> ACRS 1999 ---> Oceanography/Coastal Zone |
Sea Surface Temperature
derived from FY-2 Geostationary Meteorological Satellite
Chen
Weiying
National Satellite Meteorological Center
China Meteorological Administration, Beijing, 100081, China
AbstractNational Satellite Meteorological Center
China Meteorological Administration, Beijing, 100081, China
This paper describes algorithm of cloud detection and atmospheric correction for deriving Sea surface temperature (SST) using FY-2 Infrared Channel. It also briefly introduce SST operational processing system.
Introduction
China first launched the FY-2 Geostationary Meteorological Satellite on 10 June 1997. The Satellite carries a multi-channel scan radiometer, with a visible channel, a thermal infrared channel, and a water vapor channel. The infrared window channel (10.5mm-12.5mm) can be used to derive SST. SST is important operational product in the ground application processing system of FY-2 and useful for climate research and oceanographic application. At present, SST products derived from FY-2 are generated every at 0.5° latitude by longitude box covering the area from 50° N to 50° S and 55° E to 155° E.
SST Algorithm for FY-2
The key problems of SST derived from satellite data are recognition of cloud- contaminated data and correction of atmospheric Attenuation, because the radiation reaching the sounder aboard satellite has been contaminated by clouds and attenuated by atmosphere.
Cloud detection
The cloud detection Are based on the premises that: sea surface brightness temperature is higher cloud top, sea surface reflectance is lower than cloud top, and SST is slowly varying in space and time etc. These methods and discrimination equations for FY-2 are summarized as follows:
Histogram method
Histogram is constructed in 0.5° latitude by 0.5° longitude interval for IR (10.5 - 12.5mm) of FY-2, the following methods are used for histogram:
Sea / land discrimination
Sea / land discrimination is Preprocessing step before cloud detection.
The sea/land tags table is used to discriminate between sea and land. When 20% pixels in the histogram are located at land, the grid point of 0.5° by 0.5° is labeled as land.
Visible (VIS) and Infrared (IR) gross cloud test
Where, R is the reflectance of FY-2 visible channel. This test is only for daytime, When the reflectance of a pixel in the histogram is great than 10%, the grid point of 0.5° by 0.5° is discriminated as cloud.
Tb <270° k (for each pixel) (2)
Where, Tb is the brightness temperature of IR. This test is based on the fact sea water frizzed at 271° k. Over open ocean when Tb is less than 270° k, we can safely assume cloud is present. When Tb of a pixel in the histogram is less than 270° k, the grid point of 0.5° by 0.5° is discriminated as cloud. .
IR uniformity test and Frequency test
Where, Tbmax and Tbmin are maximum and minimum brightness temperature of IR in the histogram, respectively, and Tth is threshold value, Tth = 2.°k. If the difference between Tbmax and Tbmin is more than 2°k, the grid point of 0.5° by 0.5° is discriminated as cloud. After uniformity test passing. Then frequency test is performed.
N >80% (N=(f 1+f 2+f 3)/F) (4)
Where, f1, f2, f3 are the Frequencies for three class temperatures (tb1, tb2, tb3) of IR on the warm side of the histogram, respectively, and F is total frequencies of IR of the histogram. IF N is more than 80% for passing test, Tb0, the mean brightness temperature of cloud-free of the histogram, can be calculated:
Tb0=(tb1*f1+tb2*f2+tb3*f3)/(f1+f2+f3) (5)
Following steps are necessary for SST to perform the quality control of cloud detection:
SST Climatology test
Where, SST is the retrieved SST, and SSTclim is SST climatological temperature for the nearest 1° latitude by longitude intersection. If the difference is more than 6° C, the SST is rejected.
SST Comparison test everyday 8 times
Where, SSTmax is maximum SST in everyday 8 times, t represents the number of time in 8 times, SSTt is the SST of t time. If the range of the differences is more than 1.5° C, the SST of t. time is rejected.
SST comparison test in the five days
Where, SSTmax is maximum SST in the five days, t represents the number of day in five days, SSTt is the SST of t day. If the range of the differences is more than 3.5° C, the SST is rejected.
Atmospheric Attenuation correction
The scan radiometer on the FY-2 satellite has only one infrared window channel, SST are derived from FY-2 using a statistical estimation method. Lead to the linear approximation for the radiative transfer equation, it may be expressed as matrix equation:
Y = KT X (9)
Where Y is the matrix of observation brightness temperature differences (relative preliminary state); K is the weighted function matrix, and X is the estimated matrix. On the basis of the statistical estimative principle, estimative solutions of the equation have been got, as
ÙX = SxK (KTSxK+SY) - 1 Y (10)
Where Sx is the covariance matrix of a priory information; SY is the measurement error matrix. Then SST can be computed from the estimative values.
SST processing system
The SST processing procedure include five components: SST retrieval everyday 8-time, calculating daily mean, five-day mean, ten-day mean monthly mean SST, products verification, and output of products. Processing procedure is shown Fig.1.
Fig.1 FY-2 SST Processing Procedure
SST retrieval everyday 8-time
SST is retrieved at each 0.5° latitude / longitude grid point within the area from 50° S to 50° N and from 55° E to 155° E every 3 hours. This component includes, 1) image coordinate transform, 2) Calculating satellite zenith and solar zenith angle, 3) Converting digital count values of IR to brightness temperatures with calibration table, 4) Performing Cloud detection and Atmospheric Attenuation correction.
Calculating daily mean SST
The step is SST comparison test everyday 8 times, 8-time SST Merged and calculating daily mean SST
Calculating five-day mean, ten-day mean and monthly mean SST
Five-day mean SST are calculated from daily mean SST, ten-day mean SST are calculated from five-day mean values, and monthly mean SST are calculated from ten-day mean values.
Products verification
Product verification is to determine the accuracy of satellite-derived SST products. The SST retrievals from the above processing are compared with the conventional SST measurements from GTS. Calculating root mean square (RMS) and bias.
Output of products
Archival tape, print, image display, contour chart, and Distributing
Calculation result
Daily mean, five-day mean, ten-day mean SST products were obtained, covering the area from 50° N to 50° S and 55° E to 155° E. Fig.2 shows Ten-day SST pseudo color image in April, 1999.
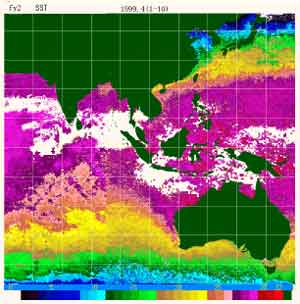
Fig.2 Ten mean SST pseudo color image of FY-2 in April, 1999
Discussion
FY-2 SST processing system can obtain more frequently SST, so that probability of obtaining cloud-free data is enhance. But the radiometer aboard FY-2 satellite has only one IR channel, the accuracy of Atmospheric Attenuation correction is not higher. The same results show RMS is about 0.9° C-2.2°C, we will improve algorithm.
References
- McClain, E. P., Pichel, W. G., and Walton, C. C., 1985, Comparative performance of AVHRRbased multi-channel sea surface temperature, Journal of Geophysical Research, Vol. 90, No. C6, 1158711602.
- Qiu Kangmu, 1987, statistical estimation method for retrieval sea surface temperature, Atmospheric Radiation progress and prospects, p.699.
- Chen Weiying, 1998, Sea Surface Temperature Retrieval From Geostetionary Meteorological Satellite (GMS-5) Infrared Split-Window Channels, Proceedings of SPIE Optical Remote Sensing of the Atmosphere and Clouds. , Vol.3501.p484.