| GISdevelopment.net ---> AARS ---> ACRS 1999 ---> Mapping From Space |
Applying Newly Developed
Calibrated Radiance DMSP/OLS Data for Estimation of Population
Mikiyasu Nakayama
United Graduate School of Agricultural Science
Tokyo University of Agriculture and Technology
3-5-8 Saiwai-cho, Fuchuu-city, Tokyo 183-8509, Japanoe
Tel: +81-42-367-5667 Fax: +81-42-360-7167
E-Mail: mikiyasu@cc.tuat.ac.jp
Christopher D. Elvidge
NOAA National Geophysical Data Center
325 Broadway, Boulder
Colorado 80303, U.S.A.
Abstract
Obtaining population data is essential to identify the probability of environmental degradation to occur in a certain area. However, in most part of the world particularly in the developing world, few reliable data on population distribution are available with reasonable spatial resolution (e.g. a few to several km.) An attempt was made to estimate population of small regions using precisely calibrated "radiation data set" by nocturnal DMSP/OLS imagery, which was newly elaborated by NOAA-NGDC. Hokkaido Island of Japan was selected as the study area, for (a) this region has a variety of population density, from very crowded city areas to virtually unpopulated rural zones, and (b) most of the pixels covering the study area are free from saturation often observed in previously elaborated "city lights data set" by extremely bright city lights. The population data of the Hokkaido in the third-order standard grid system of the Japanese government (45 arc. sec. in longitude and 30 arc. sec. in latitude - about 1 km by 1 km) after the National Census of Population conducted in 1997 were used for this analysis. Since the resolution of DMSP/OLS is 2.8 km, data sets were resampled into the grid system of 90 arc. sec. by 90 arc. sec. (about 2 km by 3 km). Regression models were developed between population density and (a) observed radiance in the "radiation data set", or (b) probability of light detection in the "city light data set". The "radiation data set" was found to represent the population density in a small region much well than the previously developed "city light data set". It was owing to the broader dynamic range of the "radiation data set" vis-à-vis "city light data set". The .radiance data set. could detect nocturnal light emitted by human activities even in low population density area of 8 residents per km2 . Further study should be carried out to see if the "radiance data set" could be useful to estimate population density in the developing world.
1. Population as cause of environmental degradation
Obtaining population data is thus essential to identify the area, where environmental degradation is likely to occur. However, in the developing world, very limited amount of reliable data on population distribution are available in particular with reasonable spatial resolution.
Attempts to estimate population with remote sensing imagery were made even in rather early days of satellite remote sensing. Ogrosky (1975) showed that population of some cities in the U.S.A. could be estimated with such parameters as area, number of links to other cities, urban area of nearest larger neighborhood, and distance to the nearby city. These parameters could be estimated with remotely sensed imagery. On a developing country, Welch (1980) suggested that population of cities in China could be expressed as a function of area of these cities as identified with LANDSAT/MSS imagery.
2. Global nocturnal light data sets with DMSP/OLS data
The Operational Line-scan System (OLS) of the Defense Meteorological Satellite Program (DMSP) detects both daytime and nighttime imagery of the Earth in two bands of VNIR and TIR (thermal infrared). The OLS is able to measure at night radiance in the VNIR band down to 10 -9 watts/cm 2 /sr/um, which is more than four orders of magnitude more sensitive than other VNIR band sensors (Elvidge, et. al., 1997a).
The NOAA/NGDC previously developed a global data set of the city lights ("city lights data set" hereinafter) by compiling hundreds of nocturnal DMSP/OLS scenes (Elvidge et. al., 1997a). In this "city lights data set", probability (0% to 100%) of detecting city lights by DMSP/OLS is given for each 30 arc. sec. grid of the world.
The NOAA/NGDC recently developed another global data set using DMSP/OLS, in which precisely calibrated nocturnal radiation in visible-near-infrared band is given for each 30 arc. sec. grid. This data set ("radiation data set" hereinafter) was synthesized with DMSP/OLS data taken when the sensor was especially set to low gain mode in March 1996, January 1997 and February 1997 (Elvidge, et. al., 1999).
3. DMSP/OLS data to estimate population
The aim of this paper is to figure out the feasibility of estimating population in small regions with DMSP/OLS data.
The magnitude of nocturnal lights in a given area is supposed to be more or less proportional to the population of the area. Elvidge et. al. (1997b; 1997c) showed that population of a country is fairly well correlated with the area lit in "city lights data set" of the same country as detected by DMSP/OLS on 52 countries of the world, both in developed and developing regions. Elvidge et. al. (1999) also showed that the cumulative radiation of 49 United States states, calculated with “radiance data set”, correlates well with population in these states. Sutton et. al. (1997) applied the "city lights data set" to estimate the population of counties in the United States. The result of these studies inspired the authors that population of smaller regions, as compared with states or counties, could be estimated using DMSP/OLS imagery.
4. Study area and data sets used
Hokkaido, the biggest island of Japan in its northern part, was selected as the study area, for (a) this region has a variety of population density, from very crowded city areas to virtually unpopulated rural zones, and (b) most of the pixels covering the study area are free from saturation in "city lights data set" caused by extremely bright city lights, as observed in the prefectures around the Tokyo metropolitan area. Hokkaido has the area of 83,411 km 2 and the population of 5.7 million.
The population data of the Hokkaido in the third-order standard grid system of the Japanese government (45 arc. sec. in longitude and 30 arc. sec. in latitude - about 1 km by 1 km) after the National Census of Population conducted in 1997 were obtained from the Japanese government.
The resolution of DMSP/OLS is 2.8 km (Elvidge, et. al., 1997a). All the data sets were accordingly resampled into the grid system of 90 arc. sec. by 90 arc. sec. (about 2 km by 3 km). Figure 1a (left) shows the study area by "city lights data set". The population density of the study area is shown as figure 1b (right).
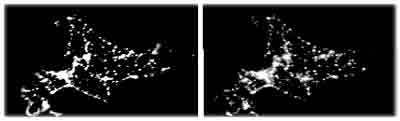
Figure 1 : Hokkaido by "city lights data set" (left) and by population density (right)
5. Relations between data sets
The relation between population density and DMSP/OLS "radiation data set" for pixels with population is shown in figures 2. The “radiation data set” apparently represents the population density much well than the “city light data set” (Nakayama, 1998). It was thanks to the broader dynamic range of the “radiation data set” vis-à-vis “city light data set”.
Figure 2: Relation between population density and DMSP/OLS "radiation data set"
6. Estimating population density
The coefficient of correlation for pixels with population, between population density and radiation, was 0.75. Multiple regression models were experimentally developed to find out if a better model could be attained or not. The result showed that neither altitude nor slope improves the accuracy in estimating the population.
Figure 3 shows those "radiated" pixels without population around the local capital of Sapporo city, which deteriorate the correlation between radiance and population. Such pixels mostly exist in either inland areas around major cities or coastal areas around major ports.
Figure 3: "Radiated" pixels without population around Sapporo city
The former is mainly due to road lights and facilities along roads (e.g. shopping malls with parking lots). The latter is due to lights in the port facilities and the same from fishing boats. Fishing boats for squid-fishing, weighting between 60 and 100 tons, are especially equipped with as many as 50 incandescent lamps with an average power of 3,500 watts per lamp in order to attract squids in the dark (Croft, 1978). This way of fishing squids is commonly practiced in the Japan Sea and the coastal zone of Hokkaido. These findings suggest, as Elvidge et. al. (1997b) implied, that the radiance data by DMSP/OLS represent power consumption of a given area much well than population density.
Contrary, some "not radiated" pixels in fact had population. Such pixels are mostly found in remote areas with relatively low population density. The radiance from such remote areas is apparently insufficient to be detected by DMSP/OLS when the sensor is in low gain mode.
Figure 4 shows the probability of a pixel being dark (i.e. no radiation detected) as a function of population within the same pixel. The “radiation data set” is slightly more sensitive to the presence of population than the “city light data set”. A pixel with 50 residents has 50% of chance to have a radiation value. Since one pixel has the area of 6 km 2 , a pixel with 50 residents corresponds to population density of 8 people per km 2 . It was even a surprise for authors that nocturnal light due to human activities could be detected even in such low population density area.
Figure 4: Probability of a pixel being dark as a function of population
7. Conclusion
The newly elaborated DMSP/OLS "radiance data set" was found a better indicator of population density in a small region, as compared with previously developed "city lights data set". It was owing to the broader dynamic range of the "radiation data set".
The “radiance data set” could detect nocturnal light emitted by human activities even in low population density area of 8 residents per km 2 . Further study should be carried out to see if the "radiance data set" could be useful to estimate population density in the developing world.
Acknowledgment
This research was supported by the Grant-in-Aid for Scientific Research on Priority Areas from the Japanese Ministry of Education, Science, Sports and Culture No. 08241105.
References
Obtaining population data is essential to identify the probability of environmental degradation to occur in a certain area. However, in most part of the world particularly in the developing world, few reliable data on population distribution are available with reasonable spatial resolution (e.g. a few to several km.) An attempt was made to estimate population of small regions using precisely calibrated "radiation data set" by nocturnal DMSP/OLS imagery, which was newly elaborated by NOAA-NGDC. Hokkaido Island of Japan was selected as the study area, for (a) this region has a variety of population density, from very crowded city areas to virtually unpopulated rural zones, and (b) most of the pixels covering the study area are free from saturation often observed in previously elaborated "city lights data set" by extremely bright city lights. The population data of the Hokkaido in the third-order standard grid system of the Japanese government (45 arc. sec. in longitude and 30 arc. sec. in latitude - about 1 km by 1 km) after the National Census of Population conducted in 1997 were used for this analysis. Since the resolution of DMSP/OLS is 2.8 km, data sets were resampled into the grid system of 90 arc. sec. by 90 arc. sec. (about 2 km by 3 km). Regression models were developed between population density and (a) observed radiance in the "radiation data set", or (b) probability of light detection in the "city light data set". The "radiation data set" was found to represent the population density in a small region much well than the previously developed "city light data set". It was owing to the broader dynamic range of the "radiation data set" vis-à-vis "city light data set". The .radiance data set. could detect nocturnal light emitted by human activities even in low population density area of 8 residents per km2 . Further study should be carried out to see if the "radiance data set" could be useful to estimate population density in the developing world.
1. Population as cause of environmental degradation
Obtaining population data is thus essential to identify the area, where environmental degradation is likely to occur. However, in the developing world, very limited amount of reliable data on population distribution are available in particular with reasonable spatial resolution.
Attempts to estimate population with remote sensing imagery were made even in rather early days of satellite remote sensing. Ogrosky (1975) showed that population of some cities in the U.S.A. could be estimated with such parameters as area, number of links to other cities, urban area of nearest larger neighborhood, and distance to the nearby city. These parameters could be estimated with remotely sensed imagery. On a developing country, Welch (1980) suggested that population of cities in China could be expressed as a function of area of these cities as identified with LANDSAT/MSS imagery.
2. Global nocturnal light data sets with DMSP/OLS data
The Operational Line-scan System (OLS) of the Defense Meteorological Satellite Program (DMSP) detects both daytime and nighttime imagery of the Earth in two bands of VNIR and TIR (thermal infrared). The OLS is able to measure at night radiance in the VNIR band down to 10 -9 watts/cm 2 /sr/um, which is more than four orders of magnitude more sensitive than other VNIR band sensors (Elvidge, et. al., 1997a).
The NOAA/NGDC previously developed a global data set of the city lights ("city lights data set" hereinafter) by compiling hundreds of nocturnal DMSP/OLS scenes (Elvidge et. al., 1997a). In this "city lights data set", probability (0% to 100%) of detecting city lights by DMSP/OLS is given for each 30 arc. sec. grid of the world.
The NOAA/NGDC recently developed another global data set using DMSP/OLS, in which precisely calibrated nocturnal radiation in visible-near-infrared band is given for each 30 arc. sec. grid. This data set ("radiation data set" hereinafter) was synthesized with DMSP/OLS data taken when the sensor was especially set to low gain mode in March 1996, January 1997 and February 1997 (Elvidge, et. al., 1999).
3. DMSP/OLS data to estimate population
The aim of this paper is to figure out the feasibility of estimating population in small regions with DMSP/OLS data.
The magnitude of nocturnal lights in a given area is supposed to be more or less proportional to the population of the area. Elvidge et. al. (1997b; 1997c) showed that population of a country is fairly well correlated with the area lit in "city lights data set" of the same country as detected by DMSP/OLS on 52 countries of the world, both in developed and developing regions. Elvidge et. al. (1999) also showed that the cumulative radiation of 49 United States states, calculated with “radiance data set”, correlates well with population in these states. Sutton et. al. (1997) applied the "city lights data set" to estimate the population of counties in the United States. The result of these studies inspired the authors that population of smaller regions, as compared with states or counties, could be estimated using DMSP/OLS imagery.
4. Study area and data sets used
Hokkaido, the biggest island of Japan in its northern part, was selected as the study area, for (a) this region has a variety of population density, from very crowded city areas to virtually unpopulated rural zones, and (b) most of the pixels covering the study area are free from saturation in "city lights data set" caused by extremely bright city lights, as observed in the prefectures around the Tokyo metropolitan area. Hokkaido has the area of 83,411 km 2 and the population of 5.7 million.
The population data of the Hokkaido in the third-order standard grid system of the Japanese government (45 arc. sec. in longitude and 30 arc. sec. in latitude - about 1 km by 1 km) after the National Census of Population conducted in 1997 were obtained from the Japanese government.
The resolution of DMSP/OLS is 2.8 km (Elvidge, et. al., 1997a). All the data sets were accordingly resampled into the grid system of 90 arc. sec. by 90 arc. sec. (about 2 km by 3 km). Figure 1a (left) shows the study area by "city lights data set". The population density of the study area is shown as figure 1b (right).
Figure 1 : Hokkaido by "city lights data set" (left) and by population density (right)
5. Relations between data sets
The relation between population density and DMSP/OLS "radiation data set" for pixels with population is shown in figures 2. The “radiation data set” apparently represents the population density much well than the “city light data set” (Nakayama, 1998). It was thanks to the broader dynamic range of the “radiation data set” vis-à-vis “city light data set”.
Figure 2: Relation between population density and DMSP/OLS "radiation data set"
6. Estimating population density
The coefficient of correlation for pixels with population, between population density and radiation, was 0.75. Multiple regression models were experimentally developed to find out if a better model could be attained or not. The result showed that neither altitude nor slope improves the accuracy in estimating the population.
Figure 3 shows those "radiated" pixels without population around the local capital of Sapporo city, which deteriorate the correlation between radiance and population. Such pixels mostly exist in either inland areas around major cities or coastal areas around major ports.
Figure 3: "Radiated" pixels without population around Sapporo city
The former is mainly due to road lights and facilities along roads (e.g. shopping malls with parking lots). The latter is due to lights in the port facilities and the same from fishing boats. Fishing boats for squid-fishing, weighting between 60 and 100 tons, are especially equipped with as many as 50 incandescent lamps with an average power of 3,500 watts per lamp in order to attract squids in the dark (Croft, 1978). This way of fishing squids is commonly practiced in the Japan Sea and the coastal zone of Hokkaido. These findings suggest, as Elvidge et. al. (1997b) implied, that the radiance data by DMSP/OLS represent power consumption of a given area much well than population density.
Contrary, some "not radiated" pixels in fact had population. Such pixels are mostly found in remote areas with relatively low population density. The radiance from such remote areas is apparently insufficient to be detected by DMSP/OLS when the sensor is in low gain mode.
Figure 4 shows the probability of a pixel being dark (i.e. no radiation detected) as a function of population within the same pixel. The “radiation data set” is slightly more sensitive to the presence of population than the “city light data set”. A pixel with 50 residents has 50% of chance to have a radiation value. Since one pixel has the area of 6 km 2 , a pixel with 50 residents corresponds to population density of 8 people per km 2 . It was even a surprise for authors that nocturnal light due to human activities could be detected even in such low population density area.
Figure 4: Probability of a pixel being dark as a function of population
7. Conclusion
The newly elaborated DMSP/OLS "radiance data set" was found a better indicator of population density in a small region, as compared with previously developed "city lights data set". It was owing to the broader dynamic range of the "radiation data set".
The “radiance data set” could detect nocturnal light emitted by human activities even in low population density area of 8 residents per km 2 . Further study should be carried out to see if the "radiance data set" could be useful to estimate population density in the developing world.
Acknowledgment
This research was supported by the Grant-in-Aid for Scientific Research on Priority Areas from the Japanese Ministry of Education, Science, Sports and Culture No. 08241105.
References
- Croft, T. A., 1978. Nighttime images of the earth from space, ScientificAmerica, 239, 68-79.
- Elvidge, C.D., Baugh, K.E., Hobson, V.H., Kihn, E.A., Kroehl, H.W., Davis, E.R., Cocero, D., 1997a. Satellite Inventory of Human Settlements Using Nocturnal Radiation Emissions: A Contribution for the Global Toolchest. Global Change Biology, 3, 387-395
- Elvidge, C.D., Baugh, K.E., Hobson, V.H., Kihn, E.A., Kroehl, H.W., Davis, E.R., Davis, C.W., 1997b. Relation Between Satellite Observed Visible-Near Infrared Emissions, Population, Economic Activity and Electric Power Consumption, International Journal of Remote Sensing, 18, 1373-1379
- Elvidge, C.D., Baugh, K.E., Hobson, V.H., Kihn, E.A., Kroehl, H.W., Davis, E.R., Davis, C.W., 1997c. Mapping City Lights with Nighttime Data from the DMSP Operational Linescan System, Photogrammetric Engineering & Remote Sensing, 63, 727-734
- Elvidge, C.D., Baugh, K.E., Diez, J.B., Bland, T., Sutton, P.C., Kroehl, H.W., 1999. Radiance calibration of DMSP-OLS low-light imaging data of human settlements, Remote Sensing of Environment, in press.
- Nakayama, M. (1998b): DMSP/OLS Imagery to Estimate Population, International Symposium on Resoutce and Environmental Monitoring, 1-4 September 1998, Budapest
- Ogrosky, C. E. 1975. Population Estimates from Satellite Imagery, Photogrametric Engineering & Remote Sensing, 41, 707-712
- Sutton, P., Roberts, D., Elvidge, C. Meij, H. 1997. A Comparison of Nighttime Satellite Imagery and Population Density for the Continental United States, Photogrammetric Engineering and Remote Sensing, 63, 1303-1313.
- Welch, R. 1980. Monitoring Urban Population and Energy Utilization Patterns From Satellite Data, Remote Sensing of Environment, 9, 1-9.