| GISdevelopment.net ---> AARS ---> ACRS 1999 ---> Mapping From Space |
Development of the Technology
of Making a High-Accuracy DEM using RADARSAT High-Resolution Data
Takaki Okatani, Nobuyuki
Watanabe and Mamoru Koarai
Geographical Survey Institute, Ministry of Construction, Japan
1, Kitasato, Tsukuba-City, Ibaraki 305-0811, Japan
Tel: (81)-298-64-1111 ex(5553) Fax:(81)-298-64-3056
E-mail: okatani@gsi-mc.go.jp
Geographical Survey Institute, Ministry of Construction, Japan
1, Kitasato, Tsukuba-City, Ibaraki 305-0811, Japan
Tel: (81)-298-64-1111 ex(5553) Fax:(81)-298-64-3056
E-mail: okatani@gsi-mc.go.jp
Keywords: DEM, SAR, RADARSAT . Stereo Matching,
Mt. Tsukuba
Abstract :
Geographical Survey Institute (GSI) developed a technology to make a DEM using RADARSET high-resolution data. We're going to show you an examlple of Mt. Tsukuba, kanto district , Japan. We used visualized RADARSAT Fine Mode ( path image plus) images and an originally developed program. We used to stereo matching method to make a DEM. The accuracy of the DEM around Mt. Tsukuba acrea compared to existing basic map was 40m in the height ( standard deviation ). It was not so far from the accuracy which was expected by the resolution of RADARSAT data and satellite positions.
1. Introduction
SAR ( synthetic aperture radar ) is a very useful method to collect information in the tropics, because optical sensors cannot get information from the earth surface as a result of thick clouds. In addition, volcanic eruptions might interrupt information from the surface. Microwaves are scarcely influenced by theses barriers . Not only are they usable to make a basic map, but they are useful to estimate degree of topographical change and to know the situation of disaster. But former existing satellite like JERS -1 and ERS-1 cannot supply sufficient data because their resolution aren't high enough. RADARSET can improve this situation. The resolution of FINE DEAM MODE OF RADARSAT is nearly 8m to both azimuth and range directions. If we use PATH IMAGE PLUS data, we can get 3.12m square grand range data. this high resolutions and high -density data might provide us very accurate and useful topographical information. We will be also able to get higher resolution data in the future. Thus, is is proper to think that making a DEM ( digital elevation model ) using SAR data will play a very important role in the future.
2. Purpose
The purpose is to develop the technology to make an accurate DEM using RADARSAT data. there are mainly tow methods to make an elevation model. First, we can make a DEM using complex data. we use the interferometry method in this case. It can produce a detailed DEM. But it takes a long time to calculate the height of each grid, because we have to consider several complex processes visualize process ( including range compression, azimuth compression ), coherency check phase unwrapping and so on. The other way is the stereo matching method . Although it can't make a detailed DEM, we don't have to consider those complex processes. The program just considers correlation of features between tow images, and these features on the ground. A positional relationship between these two images shows the height of the feature. In this case, we use visualized satellite data instead of complex data. we originally developed programs to deal with these data.
3. Contents
3.1 Observation Area and Data
This Time, we decided to make a DEM around Mt. Tsukuba ( Figure 1) which is located in northern Kanto plain. We adopted this are because this are involves both flat area and mountainous area. We used two RADARSAT visualized images
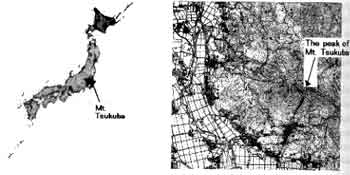
Figure 1 Observation area and topographical feature of Mt. Tsukuba ( 1:25,000 topographical map " Tsukuba ", Published by GSI Japan )
Table
1 Information for RADARSAT images
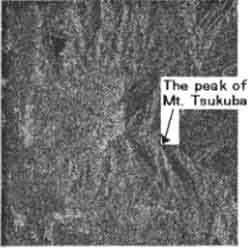
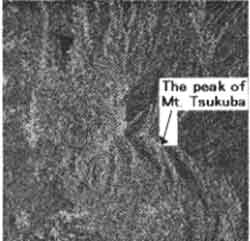
Figure 2. RADARSAT images around Mt. Tsukuba
( left : 1998.12.22, Right : 1998.12.29)
( Table 1 , Figure 2) to make a stereo pair. By matching these images, we calculated the height of each; grid in this area. A distance from the satellite to a certain feature corresponds with a projected position of the feature on the SAR image. with this idea, we can calculate the height of the feature. Since SAR data contain a lot of noises, we made correction to the data. we smoothed the data by median filter and standardized them.
3.2 Method
The method of stereo matching is as follows. First, the program decides of which point on the first (master) image the height is gong to be calculated. Second , the program reads the pattern of brightness of the area around the point. Third, the program searches the similar pattern on the second ( slave ) image. and then, suing GCPs program calculated the height of the point. We can calculate the height of the point because the data includes geometric distortions which are called " Foreshortening ". We show the concept of Foreshortening in Figure 3. the positions of a certain object on the ground on visualized SAR images just expresses a distance from the sensor to the object, and the distance varies depending on the height of the object. Fro example, the top of a building is much nearer than the bottom of the building. And the variations of the distance also varies depending on the positions of the sensor . according to figure 3, we can easily understand that if the sensor is nearer, the difference well become larger and if the sensor is farther, the difference will become smaller. In other words, the positional relationship of a certain object on the two images is different depending on the height of the object. If we know the position of each sensor, we can calculate the height of the object. If we know the position of each sensor, we can calculate the height of the point using this concept.
Figure 3 The concept of Foreshortening
4. Result
The result of matching is shown in Figure 4. the area that a DEM was made is shown in light color compared with surrounding dark area. An interval between contours on the DEM is 100m contours on a basic map for the same area also shown as background data . an interval between contours on the basic map is 10m. a matching offset of one pixel almost corresponds with height difference of 16m ( 16m-height building causes 3.125m Foreshortening difference between two images ). In other words we can't detect a small feature whose height is less than 16m. This is because we used closer satellite pair. Difference of incidence angle between tow satellites is about 5 degrees. If we used more separated pair ( Largest difference of incidence angle between two satellite which we can use is about 10 degrees ), we could detect smaller height difference which is less than 10m. averaged difference between the existing map and the DEM is around 30m and the standard deviation of residues is around 40m ( Figure 5 ,6). According to the resolution of RADARSAT, 40m is not so far from the expected value, because matching offset of 8 m between tow satellites which we used almost corresponds with height difference of 40m. Large part of this height difference is brought by flat area on the western side of the images ( mainly covered with paddy fields ) and the eastern side of Mt. Tsukuba ( Figure 5). The problem with the flat area is that the area contains few distinct features and with the eastern side of the mountains is that the satellite can't see the area sufficiently because the view from the satellite is prevented by the mountain. In both case, it is very hard to detect the same feature on each image because the brightness of the exact position and surrounding area are almost at the same and the correlation coefficients are also almost the same even if the program selected wrong point . thus , it is highly likely to miscalculate the height of a certain point on such areas . but basically , this DEM shows an approximately feature of Mt. Tsukuba and if we ignore small features like small valley's, building and son on, we can say that this DEM shows a precise features of this area.
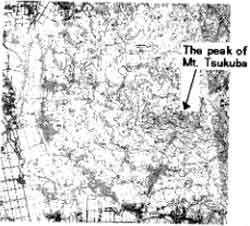
Figure 4 The existing basic map ( 1:25000, background ) and DEM ( Shown as thick contours ) by RADARSAT
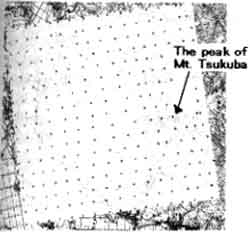
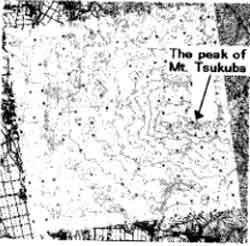
Figure 5. Grid points which were used for comparison of the two DEMs ( left ) and points which have large residue more than 25m ( right )
Figure 6 Height differences between DEM by Airborne SAR sands aerial photographs at the grid points on figure 5.
5. Conclusion
We found that we can create an approximate topographical feature by using RADARSET. the accuracy of the DEM is about 40 m and we were able to detect relatively larger features from SAR data . But we were able to find following problems during operations.
Abstract :
Geographical Survey Institute (GSI) developed a technology to make a DEM using RADARSET high-resolution data. We're going to show you an examlple of Mt. Tsukuba, kanto district , Japan. We used visualized RADARSAT Fine Mode ( path image plus) images and an originally developed program. We used to stereo matching method to make a DEM. The accuracy of the DEM around Mt. Tsukuba acrea compared to existing basic map was 40m in the height ( standard deviation ). It was not so far from the accuracy which was expected by the resolution of RADARSAT data and satellite positions.
1. Introduction
SAR ( synthetic aperture radar ) is a very useful method to collect information in the tropics, because optical sensors cannot get information from the earth surface as a result of thick clouds. In addition, volcanic eruptions might interrupt information from the surface. Microwaves are scarcely influenced by theses barriers . Not only are they usable to make a basic map, but they are useful to estimate degree of topographical change and to know the situation of disaster. But former existing satellite like JERS -1 and ERS-1 cannot supply sufficient data because their resolution aren't high enough. RADARSET can improve this situation. The resolution of FINE DEAM MODE OF RADARSAT is nearly 8m to both azimuth and range directions. If we use PATH IMAGE PLUS data, we can get 3.12m square grand range data. this high resolutions and high -density data might provide us very accurate and useful topographical information. We will be also able to get higher resolution data in the future. Thus, is is proper to think that making a DEM ( digital elevation model ) using SAR data will play a very important role in the future.
2. Purpose
The purpose is to develop the technology to make an accurate DEM using RADARSAT data. there are mainly tow methods to make an elevation model. First, we can make a DEM using complex data. we use the interferometry method in this case. It can produce a detailed DEM. But it takes a long time to calculate the height of each grid, because we have to consider several complex processes visualize process ( including range compression, azimuth compression ), coherency check phase unwrapping and so on. The other way is the stereo matching method . Although it can't make a detailed DEM, we don't have to consider those complex processes. The program just considers correlation of features between tow images, and these features on the ground. A positional relationship between these two images shows the height of the feature. In this case, we use visualized satellite data instead of complex data. we originally developed programs to deal with these data.
3. Contents
3.1 Observation Area and Data
This Time, we decided to make a DEM around Mt. Tsukuba ( Figure 1) which is located in northern Kanto plain. We adopted this are because this are involves both flat area and mountainous area. We used two RADARSAT visualized images
Figure 1 Observation area and topographical feature of Mt. Tsukuba ( 1:25,000 topographical map " Tsukuba ", Published by GSI Japan )
| Date | 98.12.22 | 1998.12.29 |
| Orbit No. | 16347 | 16447 |
| Orbit Direction | Ascending | |
| Beam Mode | FINE 4 NEAR | FINE 1FAR |
| Product Style | PATH IMAGE PLUS (SGX ) | |
| Pixel size | 3.125X3.125M | |
| Resolution | =8X8m | |
| Coordinates for image center | 36° 13' N | 36° 12' N |
| 140° 11' E | 140° 09' E | |
| Incidence Angle | =44° | =390 |
Figure 2. RADARSAT images around Mt. Tsukuba
( left : 1998.12.22, Right : 1998.12.29)
( Table 1 , Figure 2) to make a stereo pair. By matching these images, we calculated the height of each; grid in this area. A distance from the satellite to a certain feature corresponds with a projected position of the feature on the SAR image. with this idea, we can calculate the height of the feature. Since SAR data contain a lot of noises, we made correction to the data. we smoothed the data by median filter and standardized them.
3.2 Method
The method of stereo matching is as follows. First, the program decides of which point on the first (master) image the height is gong to be calculated. Second , the program reads the pattern of brightness of the area around the point. Third, the program searches the similar pattern on the second ( slave ) image. and then, suing GCPs program calculated the height of the point. We can calculate the height of the point because the data includes geometric distortions which are called " Foreshortening ". We show the concept of Foreshortening in Figure 3. the positions of a certain object on the ground on visualized SAR images just expresses a distance from the sensor to the object, and the distance varies depending on the height of the object. Fro example, the top of a building is much nearer than the bottom of the building. And the variations of the distance also varies depending on the positions of the sensor . according to figure 3, we can easily understand that if the sensor is nearer, the difference well become larger and if the sensor is farther, the difference will become smaller. In other words, the positional relationship of a certain object on the two images is different depending on the height of the object. If we know the position of each sensor, we can calculate the height of the object. If we know the position of each sensor, we can calculate the height of the point using this concept.
Figure 3 The concept of Foreshortening
4. Result
The result of matching is shown in Figure 4. the area that a DEM was made is shown in light color compared with surrounding dark area. An interval between contours on the DEM is 100m contours on a basic map for the same area also shown as background data . an interval between contours on the basic map is 10m. a matching offset of one pixel almost corresponds with height difference of 16m ( 16m-height building causes 3.125m Foreshortening difference between two images ). In other words we can't detect a small feature whose height is less than 16m. This is because we used closer satellite pair. Difference of incidence angle between tow satellites is about 5 degrees. If we used more separated pair ( Largest difference of incidence angle between two satellite which we can use is about 10 degrees ), we could detect smaller height difference which is less than 10m. averaged difference between the existing map and the DEM is around 30m and the standard deviation of residues is around 40m ( Figure 5 ,6). According to the resolution of RADARSAT, 40m is not so far from the expected value, because matching offset of 8 m between tow satellites which we used almost corresponds with height difference of 40m. Large part of this height difference is brought by flat area on the western side of the images ( mainly covered with paddy fields ) and the eastern side of Mt. Tsukuba ( Figure 5). The problem with the flat area is that the area contains few distinct features and with the eastern side of the mountains is that the satellite can't see the area sufficiently because the view from the satellite is prevented by the mountain. In both case, it is very hard to detect the same feature on each image because the brightness of the exact position and surrounding area are almost at the same and the correlation coefficients are also almost the same even if the program selected wrong point . thus , it is highly likely to miscalculate the height of a certain point on such areas . but basically , this DEM shows an approximately feature of Mt. Tsukuba and if we ignore small features like small valley's, building and son on, we can say that this DEM shows a precise features of this area.
Figure 4 The existing basic map ( 1:25000, background ) and DEM ( Shown as thick contours ) by RADARSAT
Figure 5. Grid points which were used for comparison of the two DEMs ( left ) and points which have large residue more than 25m ( right )
Figure 6 Height differences between DEM by Airborne SAR sands aerial photographs at the grid points on figure 5.
5. Conclusion
We found that we can create an approximate topographical feature by using RADARSET. the accuracy of the DEM is about 40 m and we were able to detect relatively larger features from SAR data . But we were able to find following problems during operations.
- The height of grids on a DEM is decided only by positional relationship of a certain feature between two satellites, and positional relationship is decided by only correlation of brightness between tow images. To put it in another way, the program regards two feature are the same place if correlation coefficient shows the highest value. Sometimes it doesn't work because strength of reflected waves depend on positional relationship between a feature and the satellite and the strength might be different between tow satellite images even if waves come back from the same feature. By preceding reasons, the DEM might lose its accuracy.
- The detectable minimum height difference strongly depends on the distance between the satellite position for the master image and the slave image. we used relatively closer pair , and the detectable minimum height difference is around 16m. if we use more detailed topographical feature and improve accuracy of a DEM.
- The area with few distinct features or with weak reflection because of invisibility from the satellite, leads miscalculation of a DEM. It is very difficult to make an accurate DEM for whole area because there are lots of unavoidable features that likely make errors. For example, mountains, building, paddy fields and son on. The problem of invisibility can be solved by using tow Stero pairs from different direction