| GISdevelopment.net ---> AARS ---> ACRS 1999 ---> Measurement and Modeling |
Accurate DEMlk Extraction
from SPORT Stereo Pairs: A Stereo Matching Algorithm Based on The Geometry
of the Satellite
HaeYeoun Lee * , WonKyu
Park ** , Taejung Kim ** , HeungKyu Lee *
* Department of Computer Science, ** Satellite Technology Research Center
Korea Advanced Institute of Science and Technology
373-1 Kusung-dong, Yusung-Gu, Taejon, 305-701, Korea
Tel: +82-42-869-8634, Fax: +82-42-861-0064
Email: hytoiy@casaturn.kaist.ac.kr
Keywords: Digital Elevation Model, Stereo
Matching, Epipolarity, Region growing* Department of Computer Science, ** Satellite Technology Research Center
Korea Advanced Institute of Science and Technology
373-1 Kusung-dong, Yusung-Gu, Taejon, 305-701, Korea
Tel: +82-42-869-8634, Fax: +82-42-861-0064
Email: hytoiy@casaturn.kaist.ac.kr
Abstract
The DEM is a digital data in which each point represents latitude, longitude and height. In the various ways to extract the DEMs, the use of the satellite images has many advantages. However, because of the characteristics of the satellite, it is difficult to apply the algorithms generally used. In this paper, we propose an accurate and robust stereo matching algorithm which is crucial to the quality of the DEMs. By considering the geometry of the satellite, we estimate the shape of the windows and the local support regions, Also we minimize the blunder propagation. To show the performance of our algorithms, we compared ours with the algorithms generally found in image processing textbooks on 6000x6000 SPOT panchromatic images. Based on the results, our algorithms show a good performance in the execution time and the accuracy.
Introduction
The Digital Elevation Model (DEM) is a digital data in which each point represents latitude, longitude and height. There are various ways to produce the DEMs from many types of sources such as airborne images, satellite images, etc. The use of satellite images from the DEM generation has the following advantages. 1) A scene covers larger area. 2) The satellite images are naturally digital data so that the automation can be achieved. 3) Nowadays, many remote sensing satellites are launched and it is becoming easier to get in hand. However, even if it has advantages as stated above, generating the DEMs from the satellite images suffers from shortcomings – accuracy, coverage and time.
Extracting DEMs consists of pre-processing, camera modeling, stereo matching and interpolation. Even though each step contributes to accuracy of the DEM, stereo matching is a crucial to achieve high accuracy and larger coverage of the DEMs and to minimize the execution time. If finding conjugate pairs from stereo scenes has errors, the heights must be erroneous. Moreover, when region-growing approach is employed, errors propagate to the whole DEMs. Also, the stereo matching algorithms often used in the DEM generation using aerial photos or 2.5D image generation from still camera that are set up in well-controlled manner. Mainly because; 1) Camera type is different. The position of camera changes line by line. 2) Noise due to haze and atmospheric distortion. 3) The intensities may be different so that the correspondence may be hard to be calculated if left image was taken in different date (for SPOT, always different) and/or season.
We propose a accurate and robust stereo matching algorithm that utilizes the characteristics of the satellite camera by considering followings.
- The epipolarity of the linear push-broom type camera
- The estimation of the matching window shape (size and rotation)
- The estimation of the local support regions
- The region growing algorithms and zero-mean normalized cross correlation
Epipolarity Of The Linear Pushbroom Camera
Generally, the epipolarity relation can be established in the stereo images that can be very useful in stereo matching process. However, the epipolarity for linear push-broom type camera is different from frame grabber type camera so that the equations found in image processing textbook cannot be applied [Kim, 1999a]. We derived the epipolarity for push-broom camera based on Orun and Natarazan’s camera model and we briefly summarize it here.
Figure 1 Epipolarity of the images
As shown in Figure 1, an epipolar geometry can be explained as this: one point in object image is mapped onto a unique line in search image. Suppose a beam of light is projected from the center of the left camera(Lc) through the point(Lp) on the object image. Each points lying on this beam(Li) can be mapped into the search image as a point. In the general images or airborne images, the epipolarity is represented as a linear equation. But the epipolarity of the satellite images acquired by the linear push-broom camera is represented as a non-linear equations as shown below[ Kim, 1999a].
Where (Xs, Ys, Zs) is the origin of the satellite sensor coordinate system, r11~r33 are elements of the rotation matrix which transform the satellite sensor coordinate system to the earth centered coordinate system and f is the focal length of CCD sensor. Also to model the satellite camera, Orun and Natarazan's camera model is used[ Orun, 1994].
Estimation of the Shape of the Matching Windows
Because each satellite image have a different viewing angle and direction, the size and rotation of a region (a window for stereo matching) on one scene differ from those of a region on the other scene that represents the same region. Thus, the window patch should be set differently for each scene using the viewing angles and directions of the satellite images.
 |
 |
| Figure 2 Window ratio estimation | Figure 3 Window rotation estimation |
Let us assume the geometry shown in Figure 2. Let the incident angle of left image and the right image be "a" and "b", respectively. Then the ratio of the windows can be represented as below.
Window Ratio=cos(b)/cos(a)
In general, the incident angle can be calculated from the viewing angle that can be found in the SPOT header file by solving the equations. Based on this ratio, we can determine the size of the search window relative to that of the object window.
As explained in the section 2, the images acquired by linear push-broom type camera have the epipolarity represented by non-linear equations called the epipolar curve. However, because the curvatures of the epipolar curves are not severe in the matching window, the epipolar curve can be approximated as a linear equation. Because the rotation angles of the windows can be calculated from the epipolar lines, the matching windows can be set as shown in Figure 3 so that the areas included in the windows should be as identical as possible.
Region Growings and Estimation of the Local Support Regions
In order to extract reliable DEM, it is essential to find conjugate pairs for all images. It is time-consuming to search whole search image to find the matching points for one point on the object image. Thus an efficient strategies that restricts the search areas must be considered. In this paper, the region growing approach is employed so that the knowledge of the previously matched points can be efficiently utilized. However, this approach has the problem of the blunder propagation – the error of the parent is propagated to its child [Kim, 1998].
We can assume that the candidate points (trying to match) have similar height to that of neighboring points because the abrupt changes in height is highly unlikely in 10m on the ground. Based on this assumption, we can estimate the local support regions using the indirect method of linear push-broom imagery [Kim, 1999b]. Through the estimation of the local support regions, the search area can be reduced. Thus, the time of the whole process can be minimized.
The Zero Mean Normalized Cross Correlation
Gray level correlation is the simplest but robust method as a similarity measure.[ Lemmens, 1988]. In various method for correlation calculation - cross correlation, Gaussian and Laplacian, etc., we employed the zero mean normalized cross correlation defined as below as a similarity measures because the different gray level distributions between two scenes should be normalized somehow.

Where Li and Ri are the elements of the window in object and search image, Lavg and Ravg are the average of the elements and the match point have the maximum correlation.
Stereo matching Algorithm based on the Geometry of the Satellite
In the previous sections, we have explained the techniques used in our algorithms. We now describe the complete stereo matching algorithm based on these techniques.
- Set up the camera model of the satellite. The camera model is used to estimate an epipolar geometry.
- Select an initial seed points used candidate points. In our algorithms, an initial seed points are selected by users or extracted from the ground control points automatically.
- For each point y) (x, in object image, estimate the local support regions on search image and the shape of the window for both images.
- Find a maximum correlation point.
- The 4-neighbourhood points of the match points are selected as candidate points. To preserve these candidate points, queue data structure is generally used.
- Iterate the (3) ~ (6) process until there are no candidate points.
Experiment Results
To show the performance of our algorithms, we tested three algorithms on 6000x6000 SPOT panchromatic images. For the quantitative accuracy assessment, we calculated RMS error by comparing the resulting DEMs with DTED which was produced by the USGS.
- Simple correlation algorithm (SPMatch)
- Adaptive least square correlation algorithm (ALSM)
- Our matching algorithm (EpiMatch)
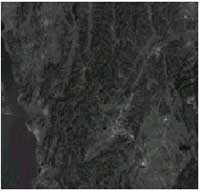
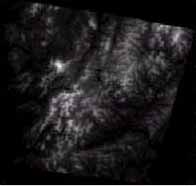
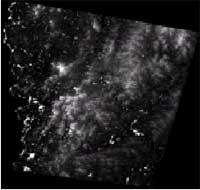
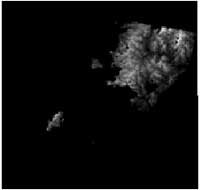
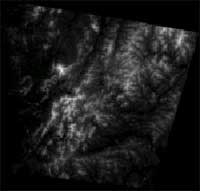
The 6000x6000 SPOT panchromatic images used as object and search image are shown in Figure 4 and 5. The results are summarized in the table 1 and the DEMs are shown in the Figure 6, 7, 8 and 9. As shown in Table 1, simple correlation algorithm takes long times however the coverage was good. But due to the blunder propagation (See Figure 7, white blobs (peaks) are errors), the accuracy of the DEMs is low. On the other hand, the accuracy of height calculated by adaptive least square correlation algorithms was high, but its coverage is substantially low (Figure 8). As shown in Table 1, RMS error of our method is 29.74m. Also, execution time was minimum of any other method at reasonable DEM coverage,
 |
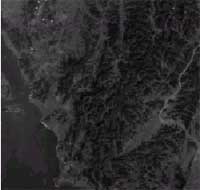 |
| Figure 4. Object SPOT Image | Figure 5. Search SPOT Image |
Table. 1 Experiment Results – Boryung, Korea
| SPMatch 3x3 | TKMatch | EpiMatch | |
| Execution Time | 1h 26m 39.71s | 22m 52.18s | 11m 20.89s |
| Coverage | 750125 | 126686 | 715262 |
| Accuracy | 88.04m | 31.02m | 29.74m |
 |
 |
| Figure 6. Truth DEM (DTED) | Figure 7. SPMatch DEM |
 |
 |
| Figure 8. ALSM DEM | Figure 9. EpiMatch DEM |
In our results, any post-processing was not applied. However, if we post-process the DEMs (automatic), we can minimize the accuracy up to 20.5m. The accuracy of our algorithms is more superior to that of the PCIÒ Software which have the accuracy of the 44.7m on the same stereo scene and the same GCPs in our experiments.
Conclusion
The extraction of the DEM from the satellite images has many advantages. But the characteristics of the satellite images make it difficult to extract the DEM. The reason is the difficulty of the stereo matching.
In this paper, we proposed the stereo matching algorithm based on the geometry of the satellite. Through the careful consideration of the satellite geometry, we could achieve high accuracy and minimize execution time in the process of the DEM extraction.
Acknowledgement
The work presented here is supported by Ministry of Science and Technology of the Government of Korea (Contract No. NN22820)
References
- Kim, T., 1999a, "A Study on the Epipolarity of Linear Pushbroom Images", Photogr. Eng. Remote Sens., (submitted).
- A. Orun and K. Natarajan, 1994, "A modified bundle adjustment software for spot imagery and photography : Tradeoff," Photogr. Eng. Remote Sens., vol. 60, pp. 1431-1437.
- Kim, T., Park W. K. and Lee, H. Y., 1998, "For better automation in DEM generati on from satellite images: Fuzzy logic approach for the determination of match quality," Proc. of ISPRS, (Ohio, USA).
- Kim, T., Shin, D., 1999b, " Development of a Robust Algorithm for Transformation of a 3D Object Point onto a 2D Image Point for Linear Pushbroom Imagery," Photogr. Eng. Remote Sens., (submitted).
- M. Lemmens, 1988, "A survey on stereo matching techniques," Proc. of ISPRS, vol. 27, pp. 11-23.
- Gruen, 1985, "Adaptive least squares correlation: A powerful image matching technique," South African J. Photogr., Remote Sens. & Cartogr., vol 14, pp. 175-187.
- G. Otto and T. Chau, 1989, "A region growing algorithm for matching of terrain image," Image and Vision Comp., vol. 7, pp. 83-94.