| GISdevelopment.net ---> AARS ---> ACRS 1999 ---> Measurement and Modeling |
Analysis and Visualization of
3D Geospatial Data by Using Delaunay Tetrahedral Tessellation
Xiaoyong
Chen
Associate Professor, Star Program
Asian Institute of Technology
P.O. Box4, Klong Luang, Pathumthani 12120
TEL: +66-2-524-6407 FAX: +66-2-524-5597
E-mail: xychen@ait.ac.th
THAILAND
Shunji Murai
Professor, Institute of Industrial Science
University of Tokyo
4-6-1 Komaba, Meguro-ku, Tokyo, 153-8505
Tel: (81)-3-5452-6407 Fax: (81)-3-5452-6408
E-mail: chiwa@shunji.iis.u-tokyo.ac.jp
JAPAN
Keywords: 3D GIS, Delaunay tetrahedral
tessellation, Analysis, and Visualization.Associate Professor, Star Program
Asian Institute of Technology
P.O. Box4, Klong Luang, Pathumthani 12120
TEL: +66-2-524-6407 FAX: +66-2-524-5597
E-mail: xychen@ait.ac.th
THAILAND
Shunji Murai
Professor, Institute of Industrial Science
University of Tokyo
4-6-1 Komaba, Meguro-ku, Tokyo, 153-8505
Tel: (81)-3-5452-6407 Fax: (81)-3-5452-6408
E-mail: chiwa@shunji.iis.u-tokyo.ac.jp
JAPAN
Abstract
Most current used methods for analyzing 3-D geo-spatial data are raster based solid models, such as voxels and octrees. Generally, a solid model can make the Spatial Data Analyzing (SDA) very fast since their simple data structures and algorithms, but it needs huge saving spaces especially for modeling accurate man-made objects. Delaunay tetrahedral tessellation (DTT) [Chen and et.al., 1994] has been concerned as one kind of simplest data structure for spatial solid modeling due to its many advantages, such as simplicial complexes, the linear combination criterion, and easy to transform and visualize. The objective of this paper is to present a set of DTT based algorithms for analysis and visualization of 3-D geo-spatial data. Some examples for analysis and visualization of 3-D geospatial data are also given to demonstrate our methods.
Introducton
Recently, many application domains, such as oil exploration, mining, geology, urban planing, environmental monitoring, archeology, intelligent transportation system, and civil engineering, need three-dimensional Geospatial Information Systems (GIS). These applications require not only modeling and visualization of 3D geospatial data, but also manipulation of these data. Most current used methods for analyzing 3D geospatial data are raster based solid models, such as voxels and octrees. Generally, a solid model can make the geospatial data analyzing very fast since their simple data structures and algorithms, but it needs huge saving spaces especially for modeling accurate man-made objects. Delaunay tetrahedral tessellation (DTT) [Chen and et.al., 1994] has been concerned as one kind of simplest data structure for spatial solid modeling due to its many advantages, such as simplicial complexes, the linear combination criterion, and easy to transform and visualize. The objective of this paper is to present a set of DTT based algorithms for analysis and visualization of 3D geospatial data. Some examples for analysis and visualization of 3-D geospatial data are also given to demonstrate our methods.
The remainder of this paper is organized as follows. Section 2 briefly introduced DTT based 3D GIS. Section 3 presented the methods for building 3D Geospatial databases. Section 4 presented algorithms for analysis and visualization of 3D geospatial data. In section 5, some examples for analysis and visualization of 3D geological data in Japan are given. Section 6 concludes this paper with further recommendations for our future research works.
Figure 1. The 3D GIS model based on Delaunay tetrahedral tessellation.
3D GIS Model Based on DTT
Delaunay tetrahedral tessellation (DTT) is an aggregate of connected but non-overlapping convex polyhedrons. It is the straight-line dual of the 3D Voronoi Diagram and can be constructed by connecting the points whose associated tetrahedral is thus formed from four adjacent points whose associated Voronoi influence volumes meet at a vertex. DTT can be used for spatial modeling by irregularly decomposing entities into tetrahedrons.
Based on DTT we developed our hybrid 3D GIS model, which include four kinds of basic structuring elements: point, line segment, triangle and tetrahedron [as shown in Figure 1]. A point is a spatial location based on defined coordinate {x y, z}. A line segment is a straight line bounded by the start and end points. A triangle is a plane bounded by three line segments, the order of segments is based on clockwise. A tetrahedron is a convex solid bounded by four triangles, the directions of boundary surfaces are their normal directions. By using these four basic structuring elements, we can represent any geographical points, lines, surfaces and solids in a 3D space. The basic data structure of our 3D GIS model also can be described by using the formal data structure of 3D vector maps [Molenaar, 1990].
Building 3D Geospatial Databases
Building a 3D-geospatial database is a very cost and time-consuming works, since the dimensional extension from 2D to 3D inevitably increases not only the size of data but also the complexity of their topological relations. Since a large amount of 2D geospatial databases have already been prepared to date on many places, t would be very labor-efficient and time-saving if the existing data sets could be directly transformed to 3D geospatial databases. Another very important problem is data integration and fusion, since 3D geospatial data are not only quantitative data acquired from existing topographical maps or traditional surveying, but also include many qualitative and half-quantitative data from other application fields, such as geology, environmental monitoring, and archeology. So our methods for building 3D geospatial databases include following main steps:
- 3D geospatial data inputting and coordinate transformation
- 3D geospatial data interpolation
- Generation of 3D geospatial objects (such as points, lines, surfaces and solids)
- 3D geospatial data merging and integration
Analysis and Visualization of 3D Geospatial Data
3D geospatial data analysis includes many logical, processing geometric processing, topological processing and some sophisticated processing such as 3D buffering and overlapping. Based on the linear combination criterion of DTT, we can easily realize the Boolean logic operations --- union, intersection, and difference, geometric transformations --- rotation, translation, scaling, and integral property computations --- volume, surface area, and distance. Since DTT s an aggregate of connected but non-overlapping convex polyhedrons, most above transformations can be realized by sum of each tetrahedral processing. The surface area of a geospatial object can be calculated by sum of its boundary triangular surfaces, which can be easily found by detection of the triangular planes belonged to only one tetrahedron. Some sophisticated processing such as 3D buffering and overlapping also can be realized based on linear combination criterion of DTT. Figure 2 shows the basic procedures of 2D and 3D buffering and overlapping.
3D geospatial data visualization generation of geometric models for displaying, and texture mapping to link with their surface images. As we mentioned before, DTT based geospatial models can be used for displaying directly, don’t need any feather interpolation. Texture mapping can be realized by mapping the ortho-images to their surfaces. At first step, we need mapping 3D triangle surfaces to each 2D ortho-image to generate related TIN on it. Then, we can translate images from each 2D triangle to its related 3D triangle. One important problem for texture mapping we should point out here is that many parts of 3D geospatial objects may don’t have surface images due to occlusions. We need interpolate these part-textures based on their neighbor importation.
Figure 2. The comparison of 2D and 3D buffering and overlapping
Examples and Conclusions
Based on the above presented algorithms and methods, we have developed a system for 3D geological data modeling and visualization in Japan. Figure 3 shows the different views of 3D geographic and geological data with their mage textures on the ground surface. Figure 4 shows a part of enlarged view ground surface with DEM, contour maps and air photos. Figure 5 shows result of under ground geological structures with overlapped map layers. In this figure we can see geological subsurface, under-ground water structures, and designed highways. Figure 6 shows the results of vertical geological cut planes with topographic maps and DEM.
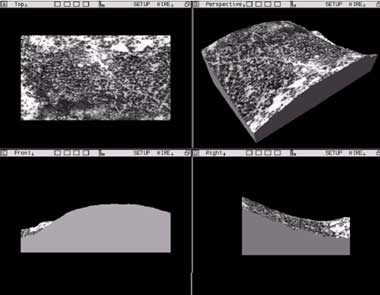
Figure 3. The different views of 3D geospatial data with their mage textures.
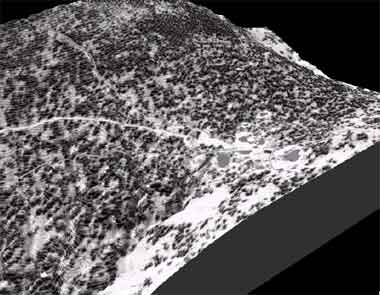
Figure 4. An enlarged view ground surface with DEM, contour maps and air photos.
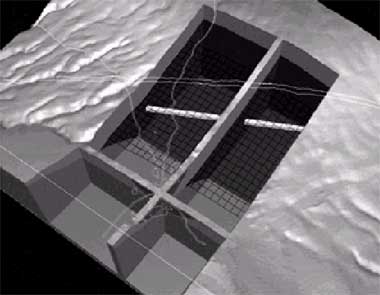
Figure 5. The result of under ground geological structures with overlapped map layers.
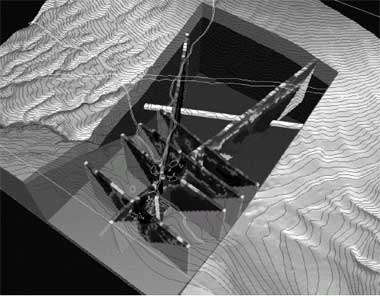
Figure 6. The results of vertical geological cut planes with topographic maps and DEM.
From above approaches and experiments we can find that the presented hybrid 3D GIS model based on DTT is a very useful tool not only for 3D geospatial data management and visualization, but also for data manipulation and sophisticated analysis. Integration of different kinds of geospatial data, such as the data from geology, urban planing, environmental monitoring and archeology, will extent wide application fields of 3D GIS.
For our further researches, the algorithms for extraction and modeling of complicated 3D geospatial objects in their detail structures by using airborne laser range scanning data will be investigated. For the application of 3D GIS, reconstruction and management of 3D geospatial objects around highway for Intelligent Transformation System (ITS) is mostly interested.
Acknowledgments
The authors wish especially to thank Dr. R. Imamura and Dr. T. Doihara for their considerable helps and supports of this research project. The first author also want to thank Asia Air Survey Co. ltd., Japan for getting the permission to use the testing geological data.
References
- Chen, X., 1991. Image Analysis and Mathematical Morphology-- the development of application models for computer mapping”. Surveying & Mapping Press, Beijing.
- Chen, X. and et.al., 1994. Raster Algorithms for Generating Delaunay Tetrahedral Tessellation. ISPRS Comm.III Symposium, Munich, Germany, pp. 124-131.
- Chen, X. and et.al., 1995. Generation of Delaunay Tetrahedral Tessellation Models for 3-D GIS. Proceedings of 6th Symposium on Functional Graphics Information System, Univ. of Tokyo, Tokyo, JAPAN, pp. 75-80.
- Fritsch, D., 1996.Three-Dimensional Geographic Information Systems --- Status and Prospects, Part B3, ISPRS XVIIIth Congress, Vienna, AUSTRIA, pp.215-221.
- Molenaar, M., 1990. A Formal Data Structure for Three Dimensional Vector Maps, 4th SDH, 2, pp. 830-843.
- Weidner, U. and W. Foerstner, 1995. Towards automatic building extraction from high-resolution digital elevation models. ISPRS Journal of Photogrammetry and Remote Sensing, 50(4):38-49.