| GISdevelopment.net ---> AARS ---> ACRS 1999 ---> Measurement and Modeling |
Simultaneous Observation of
Sea Surface Wind Speed. Significant Wave Height and Oceanic Perception
Using TOPEX Altimeter Data
Ge Chen 1,2 and
Hui Lin2
1Institute of Remote sensing Application.
Chinese Academy of Science P.O. Box 9718 Beijing 100101. China
2CAS/CHUK Joint Laboratory for Geo-Information Science
The Chinese University of Hong Kong
Shatin, New Territories, Hong Kong, China
1Institute of Remote sensing Application.
Chinese Academy of Science P.O. Box 9718 Beijing 100101. China
2CAS/CHUK Joint Laboratory for Geo-Information Science
The Chinese University of Hong Kong
Shatin, New Territories, Hong Kong, China
Abstract
In this paper, we demonstrate the role and advantage of satellite altimetry in simultaneous observation of the dynamic environment of the ocean. TOPEX data from December 1992 to December 1993 are divided into four seasons for studying the geographical distribution and seasonal variation of sea surface wind speed, significant wave height and oceanic precipitiaon . as a result, the major wind, wave and rain zones of the world oceans are identified, their variability and characteristics and analyzed, and their correlation and consistency are discussed.
Introduction
Among the satellite altimeters launched so far. TOPEX is the only altimeter, which has provided, to data the longest time series and best quality of simultaneous wind Wave and sea level observations on global scale , and has become an important data source for marine research in recent years. In addition organization\to the three fundamental elements mentioned above altimeter data can also be used to derive other geophysical parameters such as ocean tide, oceanic precipitation and marine gravity,. Etc. the point analysis of these parameters provides the possibility of a multi-discipoinary study of the ocean and will help us to better understand the comprehensive law of the ocean. In this paper , we are going to demonstrate, using sea surface wind speed, significant wave height and oceanic precipitation derived from TOPEX data, the role and advantage of satellite altimetry in simultaneous observations of the dynamic environment of the ocean.
Result and discussion
One year of TOPEX altimeter data form December 1992 to December 1993 are divided into four seasons : winter (01/12/92-28/03/93), spring
(28/03/93-29/05/93) \, summer (29/05/90-05/09/93), autumn ( 05/09/93-03/12/93). The corresponding seasonal distributions of global wind speed significant wave height and oceanic perception are shown in figure 1-3, respectively .
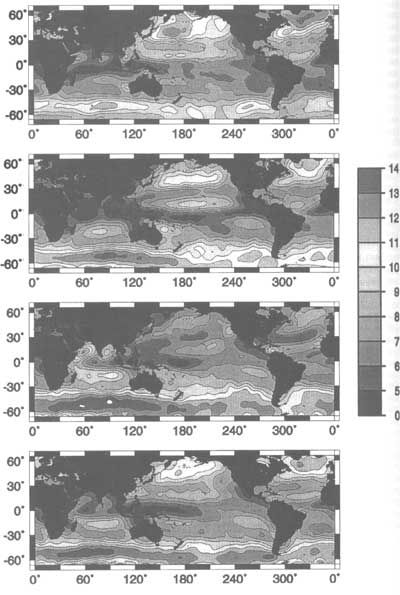
Figure 1. Seasonal maps of global sea surface wind speed derived from TOPEX altimeter data acquired during December 1992 and December 1993. From top to bottom: Winter, spring, summer and autum. The grey scale is in meter per second.
Sea surface wind speed
The wind speed distribution ( figure 1) is characterized by a zonal -banded and meridianally- oscillatd structure for all seasons. Along the equator, a low wind speed zone known as the " doldrums " can be observed. Two high wind speed belts with almost the same location and intensity, known as the southeast trade wind and the northeast trade wind, are found at about 150 of each hemisphere. A narrow zone of low wind speed known as the " horse latitudes " exists near both 250s and 250N. further poleward are the strong westerlies. The westerlies in the southern and northern hemisphere are significantly different: the one in the southern hemisphere is narrow and strong. While its north4ern hemisphere conterpart is wide and weak . the difference of their. The difference of their maximum wind speeds exceeds 2m/s. there are at least three features for the seasonal variation of wind speed . 1) as far as the spatial distribution of wind speed is concerned , the southern hemisphere exceeds the northern hemisphere in average intensity of all seasons except winter. The quarterly -averaged minimu wind speed ( below 4m/s ) of the world ocean occurs in the equatorial south pacific, while the maximum ( above 14 m/s) occurs around 500 in the southern Indian ocean. The central position of the maximum has an east-west oscillation during the year : reaching eastern most in spring (900E) and western most in autumn (600E), with an annual displacement of 300. within the latitude band between 400 and 600 of both hemispheres, there exists a permanent high wind belt known as the " roaring forties " . in the southern Ocean , the location of the strong circumpolar westerly coincides with that of the Antarctic Circumpolar current ( Chen and Ezraty, 1999), but the positions of their maximum are found to be separated 850E for the wind and 600E for the wind and 600E for the current ( Morrow et al., 1994) .2) the temporal variation of sea surface wind speed is dominated by annual component for most of the global ocean , with its maximum in winter and minimum in winter and minimum in summer. But for a few ocean area, semi -annual component is also very significant due to the influence of specific climate process such as monsoon. In some grgions, antiseasonal variation can even be observed 3) as far as annual wind speed variability is concerned, it is much higher in the northern hemisphere than in the southern hemisphere. Among the three ocean basins, the maximum wind speed variability is observed in the North Indian Ocean, as a results of the Asian Monsoon system . the entire Southern Ocean maintains a high wind situation with a low fluctuation of less than 3m/s throughout the year.
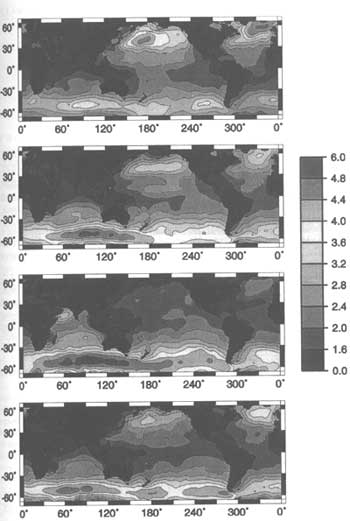
Figure 2. Seasonal maps of global significant wave height derived from TOPEX altimeter data acquired during December 1992 and December 1993. From top to bottom: Winter, spring, summer and autumn. The grey scale is in meter.
Significant Wave Height
Like the wind speed, the global distribution of significant wave height also displays a zonal -banded structure ( Figure 2). Corresponding to the " doldrums ", there exists an area which has the minimum sea state in the global ocean. There are three similar feature for the seasonal variation of significant wave height .1) . The spatial distribution of the average intensity of significant wave height in the southern hemisphere in all seasons except winter . the areas of minimum quarterly-averaged significant wave height ( below 1.6 m) are mainly located along the coastal regions within 300S and 300N . their positions are usually stable. The area with maximum significant wave height ( above 6 m) occurs around 500S in the South Indian Ocean whose central position changes with the season : it stays near 1000E in winter, spring and summer, and moves to 700E in autumn, showing an annual displacement of approximately 300. the central position of maximum significant wave height is 100 east compared to the wind speed . they have the largest separation in spring. But almost merge together in autumn. One remarkable difference between the spatial distributions of significant wave height and wind speed is that the former has ,much less zonally oriented enclosed patterns , as a result of the equatoward propagation of ocean waves generated by westerly or storms in the middle and high latitudes . 2) the temporal variation of significant wave height is also dominated by annual component for most of the global ocean, with its maximum in winter and minimum in summer. Among the several areas with anti-seasonal variations of wind speed, only the Arabian sea which is strongly affected by monsoon, retains this feature for significant wave height . 3) as it is for the wind speed, the annu7al variability of significant wave height is much higher in the northern hemisphere than in the southern hemisphere. But the difference is that, the annual maximum of significant wave height occurs in the North Atlantic. The entire Southern Ocean maintains a high sea state with a low fluctuation of less than 2 m throughout the year.
Oceanic Precipitation
similar to wind speed and significant wave height, the distribution of global oceanic precipitation is also dominated by a zonally -banded structure ( Chen et al., 197),as can be seen in figure 3 moving eastward along the equator, a prominent remain belt crossing the Pacific, the Atlantic and the Indian Ocean is found at an average latitude of 70N . within the latitude band between 100 and 300 three north4wwest southeast oriented dry zones exist in each of the basins. Their northern hemisphere counterparts can be found within the same latitude band. The six dry zones are referred to as " marine deserts ", since they are equivalent tot the continental deserts which prevail at these latitudes. Pole ward from 200S one can find three parallel rain belts one in each basin, extending southeastward from the west. Next to these rain belts, a dry belt related to the subtropical heights with its mean position varying from 400 to 550 is visible . further south, an increasing trend toward the Antarctic is seen. A similar distribution can be found for the northern hemisphere. There are at least four fundamental characteristics for the seasonal variation of oceanic precipitation . 1) the rainfall distribution is dominated by large-scale tropical features throughout the year. These features include the maximal along the intertropical Convergence Zone, the southPacific Convergence Zone, the south Atlantic Convergence Zone, and the Indonesian area of the eastern Indian Ocean. 2) An east-west annual migration of an enhanced rainy zone within the intertropical Convergence Zone, is observed in all three basins . 3) Going through the seasonal precipitation maps, a general phase opposition between the two hemispheres is discernible. It can be seen that on global scale, excluding he polar and sub-polar regions, precipitation of each hemisphere peaks in its warmer months of he year . 4) the six, " marine deserts " also have considerable seasonal changes. For example, systematic migration occurs of the North Pacific deserts whose westernmost position is found in the central western Pacific during winter time, while its easternmost position is found along the west coast of the United states in summer . the south Pacific desert undergoes an annual cycle of expansion and contraction, increasing to a maximum size in autumn and shrinking to a minimum size in spring.
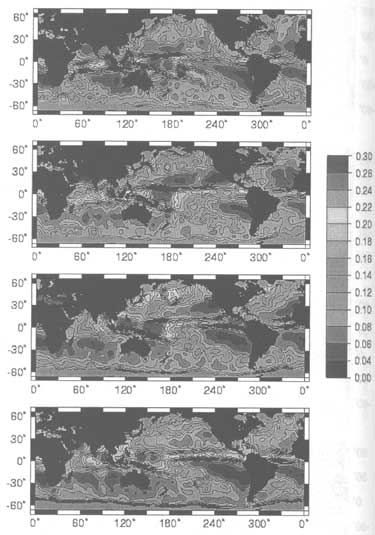
Figure 3. Seasonal maps of global oceanic precipitation derived from TOPEX altimeter data acquired during December 1992 and December 1993. Fromtop to bottom: Winter, spring, summer and autumn. The grey scale is the rain probability.
Concluding Remarks
based on the analysis of one year's TOPEX altimeter data, a number dynamic environment of global ocean have been obtained. These include have diversity of seasonal wind speed variations, the highly non -linear response of significant wave height to global wind speed, as well as the seasonal behavior of the major rainy zones and " marine deserts
" in the world oceans. With further improvement in data quality and further extension in data duration, satellite altimetry is expected to make greater contributions to the discovery of our mysterious ocean.
Acknowledgements
The authors are very grateful for sponsorships of their work provided by the National Ocean high technology Program of China ( Project 863-818-06-01-) the croucher foundation, the south china sea program of the Chinese University of Hong Kong ( Grant No. 6900707), and an open Grant of the laboratory of Remote sensing information science of the Chinese academy of sciences.
Reference
- Chen , G.B. Chapron, J. Tournadre , K. Kastsaros, and D. Vandemark.
Global oceanic precipitation: A joit view by TOPEX and the TOPEX
microwave radiometer . J. geophys , Res . ., 102, 10457-10471,
1997.
- Chen, G., and R. Ezraty. Variation of Southern Ocean sea level and
its possible relation with Antarctic sea ice. Int. J. Remote sens. , 20,
31-47, 1999.
- Morrow, R., R. Coleman, J. Church, and D. Chelton. Surface eddy
mometum flux and velocity variance in the Southern ocean from Geoset
altimetry. J. Phys. Oceanogr., 24, 2050-2071,
1994.