| GISdevelopment.net ---> AARS ---> ACRS 1999 ---> Measurement and Modeling |
Calibraiton of a
Vehicle-based Laser/CCD Sensor System for Urban 3D Mapping
Kazuhisa Inaba, Dinesh
Manandhar and Ryosuke Shibasaki
Center for Spatial Information Science and Institute of Industrial Science
The University of Tokyo, 4-6-1, Komaba
Merguro-Ku, Tokyo 153-8505, Japan
Fax: (81) -3-5452-6417
E-mail: inaba@skl.iis.u-tokyo.ac.jp
Center for Spatial Information Science and Institute of Industrial Science
The University of Tokyo, 4-6-1, Komaba
Merguro-Ku, Tokyo 153-8505, Japan
Fax: (81) -3-5452-6417
E-mail: inaba@skl.iis.u-tokyo.ac.jp
Abstract
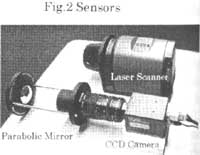
Te main objective of this research is to analyses the accuracy and calibrate the sensors to develop a mobile mapping system for automatic surveying of the 3D objects. The sensor unit of the system is composed to tow devices, a laser scanner and a CCD camera with a parabolic reflecting scanner and the CCDE camera can observe the same object simultaneously so that the textural data from the CCD camera can be directly overlaid o the 3D coordinate data from the laser scanner. DGPS/INS is used for the positions and attitude information of the; Integrated sensors units. As the first step of the development, the examination of the accuracy of the sensor devise and calibration were carried out. For the calibration sensor geometry models of the laser scanner and the CCD camera with parabolic reflecting mirror are developed.
Introduction
The mobile Mapping system is a vehicle-borne system that measures the spatial position of features, such as buildings and roads etc. recently, this kind of system has attracted attention as the accurate and the detailed urban 3D database is strongly demanded in the field, such as the visualization of the urban landscape, intelligent navigation system and so on. In this field, some approaches have already been developed. One of the approaches is ground-based mapping suing sensors like CCD camera or laser scanner or both. The 3D coordinates of the shape data from the CCD camera can be extracted by stereo matching. The difficulties in reliable Stero matching and distortion from limited resolution of CCD cameras are the major obstacles to the accuracy of this technique. Another method is to capture range data by using laser scanner . this can reconstruct detailed 3-D model, but it is difficult to find out the correspondences with the real world coordinated because of the poor understandability of the laser data.
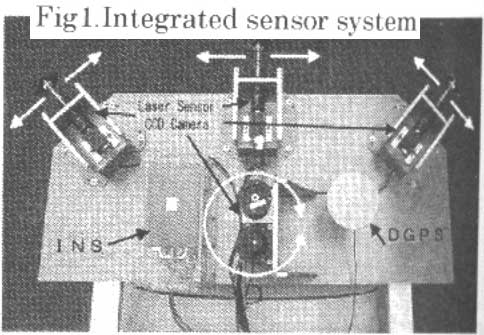
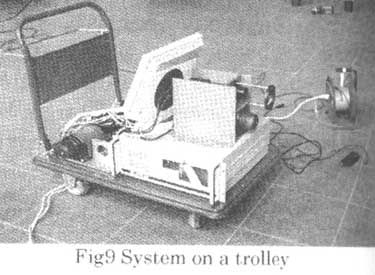
System Configuration
The system consists of four sets of sensors and one set of DGPS/INS, which are fixed on a common platform ( Figure 1) on the top of the car. Technical specification of the Laser scanner and CCD camera are shown in Table 1 and Table 2 respectively.
Table 1. Configuration of Laser Scanner
| Distance of Meas Range | 50m ( Reflection rate 20%) |
| Accuracy of Range | 3 cm( 1s) |
| Scanning Rotation | 3000 |
| Angular range step | 0.250 |
| Frequency | 10Hz |
| Interface | RS422 |
| Laser class | Level 1( Eye safe) |
| Photography Element | ½ inch color CCD |
| Resolution | 659x494 |
| Output | RGB |
| Trigger shutter | 1/60Ã1/10000 |
| Lens Mount | C mount |
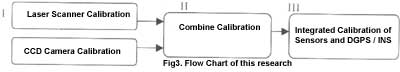
Methodology
As the first step of the development, the accuracy analysis of the sensor device and its calibration were conducted. Geometric models of the laser scanner and the CCD camera were developed for calibration. The complete calibration process was divided into three steps as shown in figure 3.
Calibration Algorithm
Laser Scanner Calibration
For the laser scanner, we have considered only the extrinsic parameters to be calibrated . the extrinsic parameters include position and the attitude of the sensor. The calibration model is given by equation 1
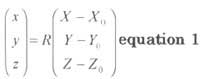
where, R ( Unknown ) and ( X0, Y0, Z0)
are a rotation matrix and real world coordinates of laser sensor; x,y,z are the coordinates of the target in laser coordinate system ( known ), and (X,Y,Z) are real world coordinates of the target where (X0, Y0, Z0, k, y, w) The position and orientation of laser scanner. (and CCD camera ) In this case of laser scanner these are known value. (x,y,z): Real coordinate of each target surveyed by Total Station
(d, q): Data measured by laser scanner. With these values, equations below can be set up.
F( X0,Y0, Z0, w, j, k)= [Ö( (X-X0)2 +(Y-Y0)2 +(Z-Z0)2)] -d
G ( X0,Y0, Z0, w, j, k)=
ArcSin[( a11(X-X0) + a12 (Y-Y0)+ A13 (Z-Z0))/(
Ö ( a11(X-X0) + a12 (Y-Y0)+ A13 (Z-Z0)2 + (a21 (X-X0)+ a22 (Y-Y0)+ a23 (Z-Z0))2) -d]
Having a Taylor series expansion of the equations around the approximate values and applying minimization, most probable value will be obtained.
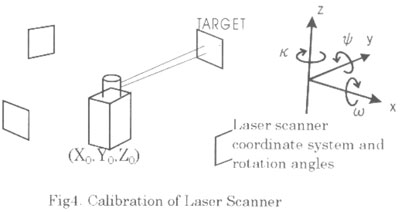
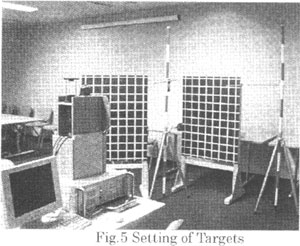
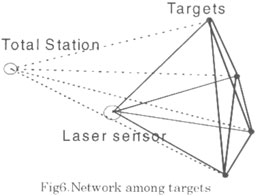
Figure 5 shows the experimental setup for laser scanner calibration. The targets were surveyed by total station. In order to analyze the accuracy of the laser scanner, and total station were compared and, their discrepancy was calculated ( Figure 6). This gives an idea about the accuracy of the laser scanner,. For the precision value, the targets were observed repetitively and the standard deviation was calculated .
CCD Camera Calibration
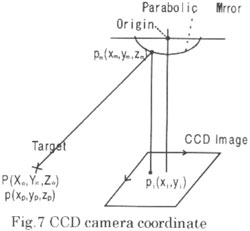
The CCD camera has a Omni-direction view, which is achieved by using a parabolic mirror ( Figure 7.). the calibration algorithm is given by equation 3-6.
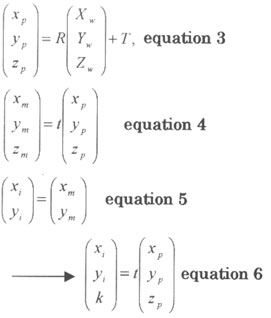
Xw …; Target on real world coordinate, Xp …; Targets on camera coordinate
Xm…; target on mirror
Xi …; Target on the image coordinate.
R, T ; rotation and transfer matrix, t; scale factor
Where k is defining the geometry of the parabolic mirror and given by k = ax2 + ay2-1/4, a is the focal length of the parabolic mirror and the origin is assumed to be the focus.
By taking xi/k and yi/k, the equation below can be get.
| { | Xir7Xw+
xi r8 Yw +
xir9 Zw + xi
T2-kr1Xw-kr2Yw-kr3Zw-kTx=0 Yir7 Xw + yir8Yw+ yir9Zw + yi T2- kr4 Xw- kr5Y- kr6Zw-kTv=0 …. equation 7 |
Calibration Target
for laser scanner calibration, 2cm x 2cm reflector targets were used. These target were placed on the trip of a wooden rod which was fixed on the calibration target board for CCD as shown in figure 8. unfortunately, the same target could not be used for the CCD and laser, due to CCD camera's poor resolution .
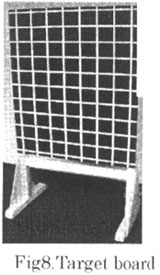
For CCD calibration, targets boards ( 80 cm x 100 cm ) were made with a grid of 10 cm x 10 cm. The background was painted black and the foreground ( which is white lines to form the grid ) was painted white to achieve maximum contrast possible. The white line width is 5 mm. The target board is shown in figure 8. survey reflectors are fixed on the target board at different locations. All ht targets are surveyed by total station.
Results and Discussion
Table 4 shows standard deviation and mean value of the repetitive measurement f laser targets by the laser scanner. This shows the precision of the instrument. It was found that at precision is about 12 cm. However, in some cases, the SD values is 6-7cm. This may be due to the orientation of the scanner with respect to the target. However, the current procedure can not verify it. The laser scanner sometimes stores the strongest gets the value it needs further study.
Table 3. Standard deviation and average of surveying by Laser scanner .
| Target 1 | Target 2 | Target 3 | Target 4 | |
| Standard deviation, mtr | 0.12 | 0.06 | 0.11 | 0.07 |
| Average, mtr | 1.65 | 1.61 | 2.00 | 2.25 |
Table 4. the discrepancy between Total station and Laser Scanner
| Target1-2 | Target 1-3 | Target 1-4 | Target 2-3 | Target 2-4 | Target 3-4 | |
| TS | 0.475 | 0.927 | 1.766 | 0.775 | 1.590 | 0.844 |
| LS | 0.478 | 1.042 | 1.943 | 0.926 | 1.808 | 0.906 |
| Discrepancy | -0.003 | -0.115 | -0.177 | -0.151 | -0.218 | -0.063 |
The laser calibration results are listed in Table 6.
Table 6: Laser Calibration Results
| Xo | Yo | Zo | Omega | Phi | Kappa |
| 3.236 | 1.625 | 0.063 | 0.0305 | 0.00494 | 3.11 |
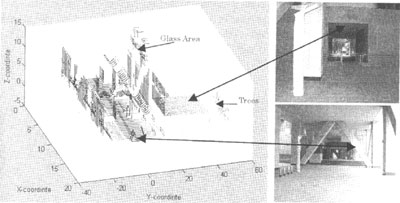
The data obtained was processed in Matlab and a 3-D plot was drawn. Since, the laser beam can pass through glass, we can notice blank holes in the data set where there exist glass windows in the building. Also, it is difficult to identify the points reflected by trees. In order t clarify these type of data. we need to have another reference image, which in this case is fulfilled by CCD image . the CCD image provides supplementary information, which minimizes the poor understandability of the laser scanner.
Conclusion
At this time, almost all the calibration have not been done, because of the difficulty of surveying by Laser scanner. But as shown in the demonstration, this system has a good performance. In this sense, the accuracy of calibration is important to build up 3D models by this system. All the calibration should be carried out step by step paying attention on the accuracy of this system.
Reference:
- Roger Y. TSAI, A Versatile Camera Calibration Technique for High-
Accuracy 3D Machine Vision Cameras and Lenses . IEEE Journal of Robotics
and Automation Vol. RA-3, No. 4 p323-344, August 1987.
- Shree K. Nayer, Catadioptric Omnidirectional Camera Porc. Of DARPA
Image Understanding Workshop May 1997
p428-488.