| GISdevelopment.net ---> AARS ---> ACRS 1999 ---> Land Use |
Land Cover Classification
using CRL/NASDA PI-SAR Data
Muhtar Qong,* Takeo
Tadono,* Hiroyuki Wakabayashi,* Masanobu Shimada *
Research Fellow, * Earth Observation Research Center, National Space Development Agency of Japan
1-9-9 Roppongi, Minato-ku, Tokyo 106-0032 Japan
Tel: (81)-3-3224-7115 Fax: (81)-3-3224-7052
Email: muhtar@eorc.nasda.go.jp
Tatsuharu Kobayashi**
** Global Environment Division, Communications Research Laboratory, 4-2-1 Nukui-kita,
Kogane, Tokyo 184-8795, Japan
Keywords: CRL/NASDA PI-SAR, Full polarimetric,
Land cover, Classification, Hokkaido.
Abstract
CRL and NASDA have collaborated to develop an airborne Polarimetric and Interferometric SAR (CRL/NASDA PI-SAR). The PI-SAR is a high-resolution, dual-frequency (L/X-band), full-polarimetric and interferometric SAR instrument. A field investigation for evaluating the potential of PI-SAR in monitoring land cover classes was conducted on a experiment forest area in Tomakomai, Hokkaido, from 12 July to 17 July 1999.
The potentiality of PI-SAR for land cover classification was evaluated. As a result, a resultant thematic layer containing seven representative land cover types in the study area was generated.
1. Introduction
The Communications Research Laboratory (CRL) of the Ministry of Posts and Telecommunications of Japan and the National Space Development Agency of Japan (NASDA) have collaborated to develop an airborne Polarimetric and Interferometric SAR (CRL/NASDA PI-SAR) and mounted it on an airplane from 1996. The PI-SAR is a high-resolution, dual-frequency (L/X-band), full-polarimetric and interferometric SAR instrument. NASDA developed the L-band SAR in order to calibrate and validate a satellite SAR system in the near future (Wakabayashi, 1999). The sensor to be calibrated is the Phase Array type L-band Synthetic Aperture Radar (PALSAR) on board the Advanced Land Observing Satellite (ALOS), which is scheduled to launch in 2002 (Shimada, 1999; Wakabayashi, 1999).
We conducted a joint CRL and NASDA flight experiment on 14 July 1999 in Hokkaido, Japan. The purposes of this study are to investigate the backscattering from different land cover targets, to evaluate the effectiveness of PI-SAR in classifying land cover classes, and to generate a land cover map of the test area using PI-SAR data. Additionally, we expect that the results from this work may be used to calibrate and validate PALSAR in the near future.
2. Study Area and the Experiment
The study area was the Tomakomai region located the southern part of Hokkaido, Japan. This is an area of coniferous and broad-leaved forest including mixed forest plantations. It is a flat region excluding a small hilly area in the western parts, ranging from 7 to 60 m above sea level. Several land cover types were distributed in the study area including water, wetland along the river, bare land including ground and paved highway, forest and urban area.
Field measurements had been taken close to the SAR data acquisition on 14 July. During the field campaign, it rained from 13 to 16 July. Hence, soil moisture content of the land surface increased continuously during the campaign (Tadono et al., 1999). Water accumulated in some flat places. Three trihedral corner reflectors with 80 cm sides and three with 60 cm sides were deployed parallel to the flight line on the bare land and inside the forest for radiometric calibration check.
3. Data Processing
A total of four polarization PI-SAR images were acquired. The delivered original image is a Multi-look Ground-range Amplitude (MGA) image and had a pixel spacing of 2.5 m (4 looks). Speckle noise was reduced using the Gamma-Map Filter with a 7-by-7 pixel moving window. Distortion was not removed because the test site is relatively flat.
The intensity of each polarization was converted to Normalized Radar Cross Section (NRCS).
Sigma°HH,VH=20log10(DN)-35.6
(1)
Sigma°HV, VV =20log(DN)-35.0 (2)
where DN is
the intensity (Digital Number) on the SAR image.
4. Methodology
A color composite image (5 km by 5 km) based on the polarization of PI-SAR data was then generated to identify the training signatures for further study. The NRCSs are computed by averaging the NRCS over all pixels belonging to the signatures contained within the 25-by-25 pixel window. The unsupervised clustering algorithm was first used to produce an adequate land cover classes to be described hereinafter (Fig. 1). Next, a supervised classification was applied. A textural algorithm was then applied to extract the urban area. Finally, the correctly classified classes were gathered in order to obtain the final classification result.
Fig. 1 Analytical procedure for PI-SAR data classification
5. Results and Discussion
Fig. 2 shows the characteristics of backscattering from different land cover types. Among land cover types, bare land represents the lowest backscattering signals. Next, the second smallest mean NRCS is observed for water. The bare land of the study area was composed of various land covers such as paved roads, ground with low grass, open land and bare soil. During the field data acquisition, there was a heavy rainfall, which continued for four days. Peculiar backscattering occurred presumably due to the water accumulation on some flat land surfaces.
Fig. 2 Changes in the mean backscatter of each land cover type for different polarizations
The standard deviation of mean backscattering of these (bare land and water) land cover types ranges from 1.17 to 3.25, and the dynamics of the mean backscattered signal ranges from -2 dB to -5 dB for all polarizations between water and bare land. Another peculiar backscattering was observed from the urban area. In particular, the standard deviation of mean backscattering is the largest among all land cover types (5.6). However, the result confirmed that the quality of PI-SAR is fairly good, and therefore PI-SAR is useful for land cover classification.
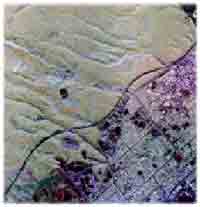
Fig. 3 Composite image based on PI-SAR images of the study area. HH, HV and VV polarization shown in RGB (Acquisition date: 14 Jul. 1999).
In the unsupervised classification, land cover was classified into seven classes. The resultant classes were compared with the ground truth and other previously published data. Each cluster was then defined as an appreciable land cover type. Figure 4 and Table 1 show the unsupervised classification result. The unsupervised classification procedure produced an adequate classification result for bare land, forest and bush land but poor results for urban area, small structures, and wetland. Figure 4 shows that forest pixels were misclassified into the urban category. Similarly, urban forest pixels were misclassified into the urban category. Presumably, these errors are due to the complexity of land cover type of the urban area. For the accuracy assessment of the unsupervised classification result, the overall accuracy is 61.7 and the overall Kappa statistics, 0.55.
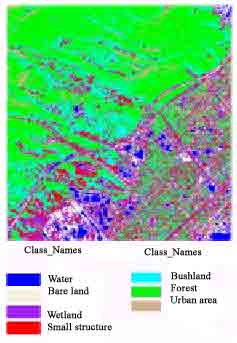
Fig. 4 Unsupervised classification of the study area.
Table 1 Signature separability for unsupervised classification (Euclidean distance)
*Using polarization: HH (1), HV (2), VH (3) and VV
(4).
The maximum likelihood classification was performed for the composite image using the evaluated signatures. Figure 5 and Table 2 show the land cover type distribution and the error matrix derived from the supervised classification. A resultant thematic layer containing seven land cover types in the study area was thus generated. However, water, small structures and wetland agreed well with the actual conditions. As in the unsupervised classification, the supervised training signatures were not representative enough to identify some classes such as urban areas. A textural image was generated in order to overcome misclassification of the urban area and improve the classification accuracy. An unsupervised ISODATA algorithm was then used to classify the textural image. As a result, the urban area itself was correctly classified as urban and others (two classes only), this classification was consistent with the actual urban area.
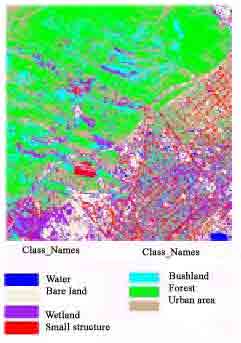
Fig. 5 Supervised classification of the study area.
Table 2 Error matrix derived from the supervised signatures.
In order to produce a final land cover map appropriate for the ground truth data or actual conditions, correctly classified classes from the three thematic layers derived from the classification procedures (layer-1, layer-2 and layer-3) were integrated (sensitivity approach). From layer-1 (unsupervised classification result), bare land, forest and bush land were accepted. From layer-2 (supervised classification result), water, small structures and wetland were accepted. From layer-3 (result of the textural image), urban area was accepted. The layers were integrated with the overlay function of the ERDAS imagine 8.3. As a result, seven representative land cover types were generated. Figure 6 and Table 3 shows resultant land cover type distribution achieved from the sensitivity approach and its accuracy report, respectively. The accuracy reports consisted of three measurements, producer's accuracy, user's accuracy, and Kappa statistics. The results of the accuracy assessment indicated that the classification procedure produced a relatively high percentage of correct results, with an overall Kappa coefficient of 0.72 and overall classification accuracy of 76.7 per cent.
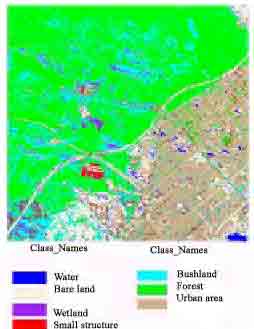
Fig. 6 Final land cover types derived from the PI-SAR image in the study area.
Table 3 Accuracy assessment report
derived from sensitivity approach.
6. Conclusion
The relations found between land cover types and multi-polarization PI-SAR data show that it is possible to use PI-SAR data to monitor land cover types. Compared with ground truth data and available published data, an accuracy exceeding 76 per cent is possible if an adequate classification procedure is used. This accuracy may be enough to produce land cover mapping using multi-polarization images, including PI-SAR and ALOS PALSAR. Classification accuracy may be improved if the multi-polarization data is combined with the multi-temporal data.
PI-SAR SAR data can be considered applicable to land cover type analysis. At present, PI-SAR L-band is operating, and in the near future, a multi-polarization spaceborne SAR system, ALOS PALSAR, will be launched. PALSAR will generate multi-polarization images in L-band. In this study, the classification accuracy has demonstrated that land cover classification mapping was possible using the L-band multi-polarization SAR data. According to Shimada (1999), global forest mapping (including Southeast Asia, Central Africa, South America and Boreal Forest) program will be carried out using PALSAR data, and detected deforestation will be compared with the Global Mapping Program by JERS-1 SAR (GFMP) data. Therefore, the multi-polarization SAR data have great potential in cloud covered tropical, sub-tropical and humid areas because the backscatter level was in different for different polarizations, and the backscatter level for specific land cover was also different for different polarizations. Based on behavior of the backscattering coefficient for the different polarizations discussed above, multi-polarization observation seems as effective for the land cover classification as optical sensors.
References
Abstract
CRL and NASDA have collaborated to develop an airborne Polarimetric and Interferometric SAR (CRL/NASDA PI-SAR). The PI-SAR is a high-resolution, dual-frequency (L/X-band), full-polarimetric and interferometric SAR instrument. A field investigation for evaluating the potential of PI-SAR in monitoring land cover classes was conducted on a experiment forest area in Tomakomai, Hokkaido, from 12 July to 17 July 1999.
The potentiality of PI-SAR for land cover classification was evaluated. As a result, a resultant thematic layer containing seven representative land cover types in the study area was generated.
1. Introduction
The Communications Research Laboratory (CRL) of the Ministry of Posts and Telecommunications of Japan and the National Space Development Agency of Japan (NASDA) have collaborated to develop an airborne Polarimetric and Interferometric SAR (CRL/NASDA PI-SAR) and mounted it on an airplane from 1996. The PI-SAR is a high-resolution, dual-frequency (L/X-band), full-polarimetric and interferometric SAR instrument. NASDA developed the L-band SAR in order to calibrate and validate a satellite SAR system in the near future (Wakabayashi, 1999). The sensor to be calibrated is the Phase Array type L-band Synthetic Aperture Radar (PALSAR) on board the Advanced Land Observing Satellite (ALOS), which is scheduled to launch in 2002 (Shimada, 1999; Wakabayashi, 1999).
We conducted a joint CRL and NASDA flight experiment on 14 July 1999 in Hokkaido, Japan. The purposes of this study are to investigate the backscattering from different land cover targets, to evaluate the effectiveness of PI-SAR in classifying land cover classes, and to generate a land cover map of the test area using PI-SAR data. Additionally, we expect that the results from this work may be used to calibrate and validate PALSAR in the near future.
2. Study Area and the Experiment
The study area was the Tomakomai region located the southern part of Hokkaido, Japan. This is an area of coniferous and broad-leaved forest including mixed forest plantations. It is a flat region excluding a small hilly area in the western parts, ranging from 7 to 60 m above sea level. Several land cover types were distributed in the study area including water, wetland along the river, bare land including ground and paved highway, forest and urban area.
Field measurements had been taken close to the SAR data acquisition on 14 July. During the field campaign, it rained from 13 to 16 July. Hence, soil moisture content of the land surface increased continuously during the campaign (Tadono et al., 1999). Water accumulated in some flat places. Three trihedral corner reflectors with 80 cm sides and three with 60 cm sides were deployed parallel to the flight line on the bare land and inside the forest for radiometric calibration check.
3. Data Processing
A total of four polarization PI-SAR images were acquired. The delivered original image is a Multi-look Ground-range Amplitude (MGA) image and had a pixel spacing of 2.5 m (4 looks). Speckle noise was reduced using the Gamma-Map Filter with a 7-by-7 pixel moving window. Distortion was not removed because the test site is relatively flat.
The intensity of each polarization was converted to Normalized Radar Cross Section (NRCS).
Sigma°HV, VV =20log(DN)-35.0 (2)
4. Methodology
A color composite image (5 km by 5 km) based on the polarization of PI-SAR data was then generated to identify the training signatures for further study. The NRCSs are computed by averaging the NRCS over all pixels belonging to the signatures contained within the 25-by-25 pixel window. The unsupervised clustering algorithm was first used to produce an adequate land cover classes to be described hereinafter (Fig. 1). Next, a supervised classification was applied. A textural algorithm was then applied to extract the urban area. Finally, the correctly classified classes were gathered in order to obtain the final classification result.
Fig. 1 Analytical procedure for PI-SAR data classification
5. Results and Discussion
Fig. 2 shows the characteristics of backscattering from different land cover types. Among land cover types, bare land represents the lowest backscattering signals. Next, the second smallest mean NRCS is observed for water. The bare land of the study area was composed of various land covers such as paved roads, ground with low grass, open land and bare soil. During the field data acquisition, there was a heavy rainfall, which continued for four days. Peculiar backscattering occurred presumably due to the water accumulation on some flat land surfaces.
Fig. 2 Changes in the mean backscatter of each land cover type for different polarizations
The standard deviation of mean backscattering of these (bare land and water) land cover types ranges from 1.17 to 3.25, and the dynamics of the mean backscattered signal ranges from -2 dB to -5 dB for all polarizations between water and bare land. Another peculiar backscattering was observed from the urban area. In particular, the standard deviation of mean backscattering is the largest among all land cover types (5.6). However, the result confirmed that the quality of PI-SAR is fairly good, and therefore PI-SAR is useful for land cover classification.
Fig. 3 Composite image based on PI-SAR images of the study area. HH, HV and VV polarization shown in RGB (Acquisition date: 14 Jul. 1999).
In the unsupervised classification, land cover was classified into seven classes. The resultant classes were compared with the ground truth and other previously published data. Each cluster was then defined as an appreciable land cover type. Figure 4 and Table 1 show the unsupervised classification result. The unsupervised classification procedure produced an adequate classification result for bare land, forest and bush land but poor results for urban area, small structures, and wetland. Figure 4 shows that forest pixels were misclassified into the urban category. Similarly, urban forest pixels were misclassified into the urban category. Presumably, these errors are due to the complexity of land cover type of the urban area. For the accuracy assessment of the unsupervised classification result, the overall accuracy is 61.7 and the overall Kappa statistics, 0.55.
Fig. 4 Unsupervised classification of the study area.
Table 1 Signature separability for unsupervised classification (Euclidean distance)
| Class names |
Class numbers |
Polarizations (Bands)* |
Average Separability |
Minimum Separability |
Class pairs and
separatibilities | ||||||
| Water | 1 | 1 , 2 | 1 , 3 | 1 , 4 | 1 , 5 | 1 , 6 | 1 , 7 | 2, 3 | |||
| Bare land | 2 | 2 , 4 | 2 , 5 | 2 , 6 | 2 , 7 | 3 , 4 | 3 , 5 | 3 , 6 | |||
| Wet land | 3 | 3 , 7 | 4 , 5 | 4 , 6 | 4 , 7 | 5 , 6 | 5 , 7 | 6 , 7 | |||
| Small structure | 4 | ||||||||||
| Bush land | 5 | 1 2 3 4 | 16 | 4 | 10 | 17 | 22 | 26 | 31 | 38 | 7 |
| Forest | 6 | 13 | 16 | 21 | 28 | 5 | 9 | 14 | |||
| Urban area | 7 | 21 | 4 | 8 | 16 | 4 | 12 | 8 | |||
The maximum likelihood classification was performed for the composite image using the evaluated signatures. Figure 5 and Table 2 show the land cover type distribution and the error matrix derived from the supervised classification. A resultant thematic layer containing seven land cover types in the study area was thus generated. However, water, small structures and wetland agreed well with the actual conditions. As in the unsupervised classification, the supervised training signatures were not representative enough to identify some classes such as urban areas. A textural image was generated in order to overcome misclassification of the urban area and improve the classification accuracy. An unsupervised ISODATA algorithm was then used to classify the textural image. As a result, the urban area itself was correctly classified as urban and others (two classes only), this classification was consistent with the actual urban area.
Fig. 5 Supervised classification of the study area.
Table 2 Error matrix derived from the supervised signatures.
| Classified Data | Reference Data | |||||||
| Water | Bare land | Wet land | Small structure | Bush land | Forest | Urban area | Row Total | |
| Water | 86.95 | 11.84 | 0 | 0 | 0 | 0 | 0 | 6445 |
| Bare land | 13.05 | 87.28 | 0.35 | 0.32 | 0 | 0 | 0.29 | 8362 |
| Wet land | 0 | 0.44 | 72.13 | 12.17 | 3.27 | 0 | 20.77 | 32996 |
| Small structur | 0 | 0.05 | 6.3 | 83.53 | 0.04 | 0 | 16 | 13261 |
| Bush land | 0 | 0 | 11.51 | 0.13 | 87.63 | 1.72 | 17.16 | 18691 |
| Forest | 0 | 0 | 0.43 | 0.28 | 3.09 | 96.64 | 4.34 | 29567 |
| Urban area | 0 | 0.39 | 9.28 | 3.57 | 5.97 | 1.64 | 41.44 | 13754 |
| Column Total | 6270 | 8387 | 37577 | 8993 | 11681 | 29082 | 21086 | 123076 |
In order to produce a final land cover map appropriate for the ground truth data or actual conditions, correctly classified classes from the three thematic layers derived from the classification procedures (layer-1, layer-2 and layer-3) were integrated (sensitivity approach). From layer-1 (unsupervised classification result), bare land, forest and bush land were accepted. From layer-2 (supervised classification result), water, small structures and wetland were accepted. From layer-3 (result of the textural image), urban area was accepted. The layers were integrated with the overlay function of the ERDAS imagine 8.3. As a result, seven representative land cover types were generated. Figure 6 and Table 3 shows resultant land cover type distribution achieved from the sensitivity approach and its accuracy report, respectively. The accuracy reports consisted of three measurements, producer's accuracy, user's accuracy, and Kappa statistics. The results of the accuracy assessment indicated that the classification procedure produced a relatively high percentage of correct results, with an overall Kappa coefficient of 0.72 and overall classification accuracy of 76.7 per cent.
Fig. 6 Final land cover types derived from the PI-SAR image in the study area.
| Class Name | Reference Totals | Classified Totals | Number of Correct | Producers Accuracy(%) | Users Accuracy(%) | Kappa statistics |
| Water | 6 | 7 | 4 | 66.7 | 57.1 | 0.52 |
| Bare land | 5 | 7 | 5 | 100.0 | 71.4 | 0.68 |
| Wet land | 8 | 7 | 6 | 75.0 | 85.7 | 0.83 |
| Small structures | 6 | 7 | 5 | 83.3 | 71.4 | 0.68 |
| Bush land | 9 | 9 | 7 | 77.8 | 77.8 | 0.73 |
| Forest | 17 | 14 | 13 | 76.5 | 92.9 | 0.90 |
| Urban | 9 | 9 | 6 | 66.7 | 66.7 | 0.60 |
| Total | 60 | 60 | 46 | - | - | |
| Overall accuracy | 76.7 | 0. 72 | ||||
6. Conclusion
The relations found between land cover types and multi-polarization PI-SAR data show that it is possible to use PI-SAR data to monitor land cover types. Compared with ground truth data and available published data, an accuracy exceeding 76 per cent is possible if an adequate classification procedure is used. This accuracy may be enough to produce land cover mapping using multi-polarization images, including PI-SAR and ALOS PALSAR. Classification accuracy may be improved if the multi-polarization data is combined with the multi-temporal data.
PI-SAR SAR data can be considered applicable to land cover type analysis. At present, PI-SAR L-band is operating, and in the near future, a multi-polarization spaceborne SAR system, ALOS PALSAR, will be launched. PALSAR will generate multi-polarization images in L-band. In this study, the classification accuracy has demonstrated that land cover classification mapping was possible using the L-band multi-polarization SAR data. According to Shimada (1999), global forest mapping (including Southeast Asia, Central Africa, South America and Boreal Forest) program will be carried out using PALSAR data, and detected deforestation will be compared with the Global Mapping Program by JERS-1 SAR (GFMP) data. Therefore, the multi-polarization SAR data have great potential in cloud covered tropical, sub-tropical and humid areas because the backscatter level was in different for different polarizations, and the backscatter level for specific land cover was also different for different polarizations. Based on behavior of the backscattering coefficient for the different polarizations discussed above, multi-polarization observation seems as effective for the land cover classification as optical sensors.
References
- Aplin, P., Atkinson, P. M., and Curran, P. J., 1999. Fine Spatial Resolution Simulated Satellite Sensor imagery for Land cover Mapping in the UK, Remote Sens. Environ., 68: 206-216.
- Congalton, R. G., 1991. A Review of Assessing the Accuracy of Classification of Remotely Sensed Data, Remote Sens. Environ. 37: 35-46.
- ERDAS, ERDAS Field Guide, Fourth Edition, Revised and Expanded, ERDAS, Inc., Atlanta, Georgia, p. 35, p. 152, 153.
- Qong, M. 1999. Evaluation of JERS-1 SAR Data for Vegetation Type in Arid regions. J. of JSPRS, Vol.38, No. 4, pp. 4-16.
- Shimada, M., 1999. Development, calibration, validation and study plan of the higher product processing algorithm of EORC. J. of JSPRS, Vol.38, No. 2, pp. 39-42.
- Tadono, T., Qong, M., Wakabayashi, H., Shimada, M., Kobayashi, T., and Shi, J., 1999. Preliminary Studies for Estimating Surface Moisture and Roughness Based on a Simultaneous Experiment with CRL/NASDA Airborne SAR (PI-SAR). 20 th , ACRS, Hong Kong.
- Wakabayashi, H., 1999. Potentiality, characteristics and possibility of PALSAR. J. of of JSPRS, Vol.38, No. 2, pp. 31-38.
- Wakabayashi, H., Kobayashi, T., Satake, M., and Uratsuka, S., 1999. Airborne L-Band SAR System: Charateristics and Initial Calibration Results. IGASS symposium, Hunburg, Germany.