| GISdevelopment.net ---> AARS ---> ACRS 1999 ---> Land Use |
Geo-Interpretation Model for
Land-Cover/Land-Use Classification
Zhou chenghu Luo Jiancheng
State key Lab Resource and Environment Information System,
CAS, Beijing, China, P.R., 100101
Hui Lin
Department of Geography, Chinese University of Hong Kong
State key Lab Resource and Environment Information System,
CAS, Beijing, China, P.R., 100101
Hui Lin
Department of Geography, Chinese University of Hong Kong
Abstract
Land-cover/land-Use has become crucial basis work to carry out the prediction to the dynamical change of land-use, prevention to natural disaster, environment protection, land management and planning. With rapid development of remote sensing technology, especially deeply studies in remote sensing geo-analysis modes, remote sensing land-cover/land-use classification has become the most credible, rapid and effective measure to monitor the condition and changing of land-cover/land-use in the ;global surface. In this work, firstly authors will give the review of traditional land-cover/land-use RS classification. Traditional land-cover/land-use remote sensing classification methods mainly include three models. They are mathematical and statistical theory based classification model, neural computation theory based classification model, and symbolic logic reasoning based classification model Under these methods, authors then propose the remote sensing intelligent Geo-Analysis model names remote sensing intelligent geo-interpretation model (RSIGIM).In so that the Geo-Decision knowledge can be structurally and parametrically fused in. Based on this model we will build the new systematic structure of land-cover/land-use RS classification with the example case in Hong Kong Island by multi-dimensional spatial; data fused between the multi-platform remotely sensed data and ancillary geography data.
Introduction
Land-Cover/Land-use, being the new concept developing with the remote sending technology, has become a crucial item of basic tasks in order to carry through a series of important works, such as the p0rediction of land-use change, prevention of nature disaster, management and plan pf lam -use, protection of environment, etc,. With the more thorough development of remote sensing technology and Geo-Analysis model, using remotely sensed data to monitor the status and dynamical change of land-cover/land-use is become the one of the one of the most rapid, credible and effectual method.
Land-cover and Land-use are two different concepts in its intrinsic signification .Land-cover emphasize particularly on its nature properties and it is the synthetically reflection of various elements in global surface covered with natural body or manual construction. Using remote sensing classification method, whatever used or non\-used covering object in surface can be separated. However, Land-use, emphasizing more on land's social properties, is the output of reconstruction activities that human adopts a serials of biologic, technologic measure to manage and regulate the land chronically and periodically according to determinate economic and social purpose. Thus, land-use is a process of turning natural ecosystem into social ecosystem, and the process is a complicated procedure by the synthetic effect from nature, economy and society. The manner, degree, structure, area distributing and benefit of land-use are not only affected by natural condition nut also restricted by diversified natural, economic and technologic condition, and in sometimes among all factors the social production form is determinant Land-use is the most direct and leading driving factor to the land-cover change.
In carrying out research and application of the land-covert and land-use remote sensing investigation, the uniform classification system is usually built up by combining the two concepts under one system, which is called Remote Sensing Land-Cover/Land-Use classification system. IN this paper, we will initially build the intelligent land-cover/land-use classification system that is supported with the proposed model named Remote Sensing Intelligent Geo-Interpretation Model (RSIGIM) basic on the data fusion among multi-platform remote sensing data, geographical ancillary data and geo-knowledge. The multi-platform remote sensing data includes TN,SPOT-HRV, and the geographical ancillary data include topological data and land-cover/land-use classification methods are reviewed. Then in third part, the RSIGIM will be presented out and its land-cover/land-use classification system also is discussed in this part. The application and output evaluation will be talked about in part four. In the end, we will tine the conclusions and prospects.
Conventional Land-Cover/Land-Use Classification Methods
Conventional land-cover/land-use remote sensing classification methods mainly include traditional classification methods, neural networks based classification methods and symbolic knowledge based logic reasoning classification method .
Traditional Land-cover/Land-use RS Classification
Traditional remote sensing image classification can be classified into rationalization method, hierarchical classification method, decision-tree classification method, and statistical classification method, etc. Every method has its geo-background. For example, rationalization and hierarchical classification, mainly according to the geo-difference rule in remote sensing image, are to step wisely classify the image from sketchy degree to subtle degree to subtle degree by different classification decision rules in different hierarchy, such as the decision tree mode by landscape difference in remote sensing image. These traditional classification method require that the one who want to do classification should master the geo-regularity in the remote sensing image to a sufficient degree, or the outcome is difficult to reflect to reflect the true geo-distribution. Therefore, the limitation to the traditional method is the difficulties to hold the criterion of classification and qualitative component in the method is primary.
Based on mathematical and statistical analysis model, a lot of remote sensing classification and information extraction methods already has been developed The typical methods include ISODATA clustering, minimum distance methods, maximum like classification, etc, which are all based on parametrically or non parametrically statistical distribution model to do the basic processing and analytical process to the remote sensing image by mathematical computing and statistical analysis. With MSC model and the fact that the statistical difference exists between datum in feature space, the primary cognition to the RS image including the basic land-cover unit classification and information extraction can be realized. But for no integrating with geo-knowledge MSC is difficult to truly reflect come special geo-distribution and especially the defect of being difficult to gain the parameters of the parametric model is existing when processing or analyzing the complicated spatial information.
Neural Networks Based Land-Cover/Land-Use Classification
Comparing to the traditional classification methods, artificial neural networks (AQNN)based classification method simulates the human vision and neural processing system to get the cognition to the RS image. Neural-network classifiers are non-parametric and therefore may be more robust when distribution are strongly non-Gaussian. During training, the network to capable of forming arbitrary decision boundaries in the feature space. With distributed knowledge represented in the neural network and the knowledge got by training the priori samples of datum the neural network, can be get complicated and nonlinear mapping ability to realize the land-cover hierarchical classification from coarse degree to subtle degree with scale space changed. Thus, ANN method generally can get more high accuracy of the outcome and have been widely used in land-cover/land-use classification. Especially ANN's superiority is showed to the complicated land type.
Since the publication of Rumellhart and McClelland(1986),there has been a renaissance of interest in using neural network, particularly back-propagation neural networks, for land-cover/land land-use classification. Howald(1989).McClelland (1989), Hepner (1990), T.yoshida(1994),K>S>Chen(1995),J.D.Poala(1997),etc, all used ANN method in the land-cover classification by TM image, and in vary degree the accuracy is improves. Kanellopoulos(1992) used FANN method to classify the land -cover into 20 type with SPOT-HRV image, and its outcome got better accuracy than general statistical method. By ANN method, G.M.Foody(1996) separated the mixed pixel in land-cover. Under the basis of TM remote sensing data, spatial context information data, ancillary information (including DEM and slope), L.Bruzzpne (1997) classified the complicated land-cover using ANN method and 9%improvement in accuracy comparing to the maximum like hood classifier.
Despite its strong non linear mapping ability to processing and analyzing the remote sensing information with complicated spatial distribution, most ANN methods are also just a computing behavior like general computing models. Therefore, ANN method without being supported by geo-knowledge also can nota truly reflect the distribution character of some special type of phenomenon in remote sensing image.
Symbolic Knowledge Reasoning Based Land-Cover/Land-Use Classification
Recently, in the research and application of remote sensing land-cover/land-use classification, the knowledge based logic reasoning classification method or even to build expert system have been carried out and have got fruit progressing. A symbolic knowledge based system may be a large and complex set pf program functioning as an expert system that simulates the higher-order interpretative processes of human analysts When such knowledge representation imitates of simulates the logic of human perception, it is called machine or computer vision.
With the support of symbolic geo-knowledge base, including spectral knowledge base, topological knowledge base and land-use knowledge based, and logic reasoning machine, the classification outcome of land-cover can be validated and modified by obeying to the facts and rules in the realistic land cover and land use distribution. By building the spectral knowledge base, S.W.Wharton(1987)improved the accuracy in urban land-cover classification. B.Kartikeyan (1995) built the frame work of remote sensing land-cover classification expert system including spectral knowledge base, reasoning machine, knowledge automatic acquisition unit, by which the example work land-cover classification cal carried out.
Based on conventional geo-analysis thought of geo-difference in geo-phenomenon, symbolic knowledge based logic reasoning remote sensing classification method realizes the discriminance in remote sensing image by symbolic representing to the geo-knowledge and formalization reasoning machine. Thus, in some degree it can truly reflect the geo-distribution in the remote sensing image. But for the characteristics of RS information being fuzzy and complicated, it is difficult to represent the land-cover regularities and duynami9cal growing process hidden in remote sensing by structural and symbolic geo-knowledge. Further more, for remote sending image generally comprise huge information, the efficiency should nesting site low when using serial symbolic reasoning forms to processing and analyzing the image data.
Remote Sensing Intelligent Geo-Interpretation Modal
In this section, we will propose a classification system named RSIGIM/ Remote Sensing Intelligent Geo-Interpretation Modal (RSIGIM) is a hierarchical processing and analyzing modal to research how to simulate the synthetically Geo-expert's interpretation and decision process to the remote sensing image by computer system. From law level to high level, RSIGIM passes through several courses including information transfers, statistical basic processing and analyzing unit, physiological vision cognition, psychological logic cognition, knowledge discovery, decision and analysis. The process is just like the intelligent interpretation process of an expert to picture from receiving, observation, judgment, association to memory . (Figure1).
Figure 1: The Framework of RS Intelligent Geo-Interpretation Model
There are several targets of to present out the RSIGEM as below.
Figure 2 Systematic Structure of land -cover classification based on RSIGIM
Example Application
Study sites and Data
Our study area is located at Hong Kong Island, where is south of Hong Kong Region, in southern china. (Figure 3). In this area, the status of topography is very steep and mountainous. Urban area distributes along the fringe of the island, where mainly is dependent to the filling sea to increase the urban region since the first exploring to this land one hundred and fifty years ago.
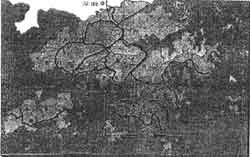
Figure 3 Study Area in Hong Kong Administration Map.
The data in this experiment includes Remote sensing data and ancillary geographical data. Land-sat TM imagery flown on 3 March 1996 and SPOT-HRV imagery flown on 2 February 1999 were available for the study. The ancillary geographical data is DEM data and its byproducts including slope and aspect data. The land-use map finished by experts vision interpretation also is used in validation and updating to the land-use by land-cover classification outcome by building land-use knowledge base. Figure is the 3D- display image effect of Hong Kong Island, which is overlaid by TM 5,4,3 band colored with Red, Green and Blue respectively. Figure 5 is SPOT HRV imagery covered on Hong Kong Island.
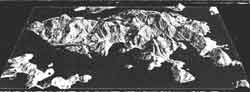
Figure 4 3D display of HK Island overlaid by TM 5,4,3 with R,G,B color.
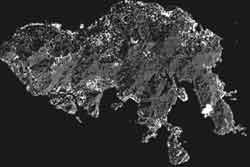
Figure 5 SPOT-HRV covered in Hong Kong Island (2 Feb. , 1999)
With basis on the vision interpreting to the remote sensing image in Fig. 4,5, we can find out that in Hong Kong Island the land-cover type is very complicated and anfractuous for its steep topography and sinuous distribution of urban region. By multi-platform remote sensing image data and synthetical analysis methods to investigate the status of land-cover/land-use will provided us punctual, dynamical and fast validation and updating information to the advanced land decision and planning is such an urban region. Based on RSIGIM model in this work, we have designed a hierarchical classification system to Hong Kong Island land-cover/land, which is also divided into three levels corresponding with the structure of RSIGIM. Level one is the preprocessing to the spatial data in order to enhance information or do basis preparing works for next stage. Level two is to do the coarse to subtle classification under the RS data sources from the TM to SPOT with supported by suitable neural computing algorithms. Level three is to validate and update the landuse with supported by geo-knowledge processing system under the classifying outcome in level two.
Preprocessing to the spatial data
With supported by the first level of RSIGIM, preprocessing to the spatial data is necessary for doing the basis processing works in order to be prepare for next higher cognition process or enhance the effect of the vision of RS image. The preprocessing process mainly should include image enhancement, geometric correction, statistical transformation, etc. For instance, in this sample, the main preprocessing works for land-cover classification is done as below.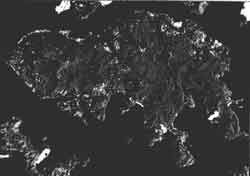
Figure 6 Classification Map by Clustering Method
Geo-knowledge Processing
The geo-knowledge in general RS land-cover /land-use classification system mainly includes:
Coarse classification by TM imagery
In the coarse classification, the spatial data includes TM remote sensing data and topological data. There- into TM data includes 4 bands (TM123,CH4,CH5,CH7), in which TM123 is the first component of PCA transformation to the visible bands (CH1, CH2 ,CH3) Topological element include altitude, slope and aspect data. The main process of coarse classification under these spatial data is described as below. After geometric correction the size of data matrix is row 400 by column 540, which covers the whole island

Figure 9 RBFNN Remote Sensing Image Classification Flow.
In this sample, we firstly select 1000 samples with prior knowledge from the TM image with help of vision interpretation to training the RBFNN. After training, the vectors from image are fed into RBFNN pixel by pixel, and by passing through in network the classifying belief vector m1 is outputted in output layer. Simultaneously, the spatial vector also is inputted into reasoning machine to output the another classifying belief vector m2. By D-S evidential reasoning method the overall belief vector m can be got by m1+m2, and in the vector m2 choosing the maximum dimensional value as the classification type. Figure 10 is the outcome of classification. We select 500 test samples at random sites in image to test the accuracy of methods. Table 1,2,3 respectively is the error matrix of conventional statistical maximum likelihood classifier, RBFNN with rule supported and with no-rule supported. We can find that RBFNN can get more high accuracy while keeping high training efficiency comparing to traditional statistical classifier.
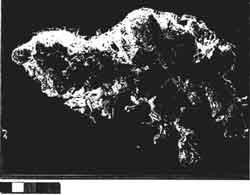
Figure 10 Land-Cover Classification by neural nerwork method based onTM and knowledge base
Table 1 Error Matrix of MLC Classification (Accuracy = 89.74%,
Kappa=0.873)
Table 2 Error Matrix of RBFNN with no rule supported (Accuracy
= 96.60%, Kappa=0.95)
Table 3 Error Matrix of RBFNN with rule supported (Accuracy =
97.00%, Kappa=0.963)
Subtle Land-Cover classification by SPOT HRV imagery
After coarse classification to get the main land-cover map under TM data, every type is fused with SPOT-HRV data to form into second subtle distribution structure. Then using ARTMAP method the second layer of subtle classification map can be acquired also with supported by topological and spectral knowledge base.
Adaptive Resonance Theory (ART) networks (Carpenter and Grossberg 1988) are most useful for clustering analysis, classification and recognition. The ART suggests a solution to the stability-plasticity dilemma during the designing of learning systems. Fuzzy ARTMAP has been proposed by Carpenter et al. (1991) as a direct generalization of ARTMAP for supervised learning of recognition categories and multi-dimensional maps in response to arbitrary sequences of continuos-valued patterns not necessarily interpreted as fuzzy set of features. Fuzzy-ARTMAP synthesizes fuzzy logic and ART models by describing the dynamics of ART category choice, search and learning in terms of analog fuzzy set-theoretic rather than binary set-theoretic operations. Fuzzy-ARTMAP is designed to solve supervised dimensions, where mapping is learned by example from pairs (A,B) of sequentially presented input and output vectors. The ARTMAP system incorporates two ARTI modules, respectively.
On the basis of the first classifying layer of TM, the second classifying layer can be divided into 10 land-cover type as listed in Figure 11. Table 4, Table 5 and Table 6 respectively is the error matrix by conventional BPNN, ARTMAP and symbolic knowledge based ARTMAP method. We can find that ARTMAP and knowledge based ARTMAP method can get more high accuracy while improving the training efficiency. Figure 12 is the outcome of subtle land-cover classification by SPOT HRV image supported by Knowledge base.
Figure 11 The Second Layer of Land-Cover Classification strategy
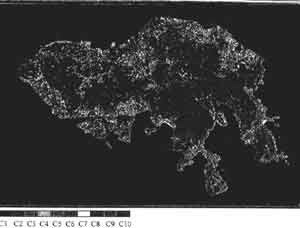
Figure 12 Land-Cover Classification by neural network method based on Based on SPOT and knowledge base
Table 4 The Error Matrix of MLC Classifier (Accuracy=58.85%,
Kappa=0.543)
Table 5 The Error Matrix of ARTMAP Classifier (Accuracy=65.70%,
Kappa=0.619)
Table 6 The Error Matrix ARTMAP Classifier (Accuracy=75.30%,
Kappa=0.726)
Validation and updating to Land-use
In the end, compared to the land-use map acquired from expert vision interpretation and with supported by ancillary geo-knowledge the validation and updating to the land-use can be achieved. But firstly we should know that there exist difference in classification rule between land-cover and land-use as discussed in previous section. For instance, the public land-use and greenbelt, residents in land-cover are in some degree interlaced. Because these really exists limitation for remote sensing land-cover classification for the feature of uncertainty and fuzziness of remote sensing information that result in impossibly distinguishing all land-cover type just using Remote Sensing data. Therefore, the ancillary knowledge is necessary on invalidating and knowledge base is also organized by RULE format. As below some items of rule are listed. Figure 13 is the outcome of the land-use map invalidated and updated from land-cover classification map.
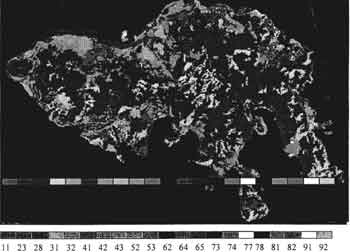
Figure 13 The Land-Use Validation and Updating Map from land-Cover classification.
If ((cls<=1.000000) and ((land>= 71.000000) and (land<=79.000000))) then id=abs (land)
If ((land=11) or (land = 12 )) and (cls=1) then id=71
If ((land=11) or (land = 12 )) and (cls=2) then id=41
If ((land=11) or (land = 12 )) and (cls=3) then id=42
If ((land=11) or (land = 12 )) and (cls=4) then id=62
If ((land=11) or (land = 12 )) and (cls=5) then id=91
If ((land=11) or (land = 12 )) and (cls=6) then id=91
If ((land=11) or (land = 12 )) and (cls=7) then id=91
If ((land=11) or (land = 12 )) and (cls=8) then id=abs(land)
If ((land=11) or (land = 12 )) and (cls=9) then id=24
If ((land=11) or (land = 12 )) and (cls=10) then id=31
If ((land>=21) and (land< =25 )) and (cls=1) then id=72
If ((land>=21) and (land< =25 )) and (cls=2) then id=41
If ((land>=21) and (land< =25 )) and (cls=3) then id=42
If ((land>=21) and (land< =25 )) and (cls=4) then id=62
If ((land>=21) and (land< =25 )) and (cls=5) then id=91
If ((land>=21) and (land< =25 )) and (cls=6) then id=91
If ((land>=21) and (land< =25 )) and (cls=7) then id=91
If ((land>=21) or (land <=25 )) and (cls=8) then id=abs(land)
If ((land>=21) or (land <=25 )) and (cls=9) then id=abs(land)
Summary and Conclusions
A long term's goal of our studies is to develop models for integrated spatial data and spatial Geo-analysis model with Geo-knowledge model. In this paper, we firstly proposed the RSIGIM model for remote sensing intelligent cognition. RSIGIM is a hierarchical model with three levels of models and methods. All of these three levels of model and methods applied in realistic classification and information extraction need geo-knowledge and ancillary information being fused in, but differences exist in fusing mode and degree.
Mathematical and statistical classification (MSC) model is based on parametrically and non-parametrically distribution model to do the basic processing and analytical process to the remote sensing image by mathematical computing and statistical analysis. With MSC model and the fact that the statistical difference exists between datum in feature space, the primary processing and cognition to the remote sensing image can be realized.
Neural computation theory based classification (NCC) model simulates the human vision and brain neural processing system to get the cognition to the RS image. With distributed knowledge represented in the neural network, and the knowledge got by training the priori samples of datum, the neural networks can be get complicated and nonlinear mapping ability to realize more complex classification and extraction from coarse degree to subtle degree.
The third is symbolic logic reasoning classification (SLRC) model. With the support of symbolic geo-knowledge base, including spectral knowledge base, topological knowledge base and land-use knowledge base, and logic reasoning machine, the classification outcome can be validated and modified by obeying to the facts and rules in the realistic land cover and land use distribution. Aiming at the land-use map from manual interpretation to the RS photo, updating and decision can be arrived in some degree.
After we outline the RSIGIM model, the basic intelligent land-cover/land-use classification framework and technology system based on RSIGIM is proposed out, by which the process and procedure of land-cover/land-use classification in Hong Kong Island are described and the outcome is evaluated.
Acknowledgements:
The authors would like to thank Prof. Yee Leung of Chinese University of Hong Kong for kindly advice on some algorithms of neural networks and cooperation on the developing the geo-Expert System Software. The authors wish to thank Dr. J.H. Gong and Dr. Hui Lin for helpful suggestions and comments.
References:
Land-cover/land-Use has become crucial basis work to carry out the prediction to the dynamical change of land-use, prevention to natural disaster, environment protection, land management and planning. With rapid development of remote sensing technology, especially deeply studies in remote sensing geo-analysis modes, remote sensing land-cover/land-use classification has become the most credible, rapid and effective measure to monitor the condition and changing of land-cover/land-use in the ;global surface. In this work, firstly authors will give the review of traditional land-cover/land-use RS classification. Traditional land-cover/land-use remote sensing classification methods mainly include three models. They are mathematical and statistical theory based classification model, neural computation theory based classification model, and symbolic logic reasoning based classification model Under these methods, authors then propose the remote sensing intelligent Geo-Analysis model names remote sensing intelligent geo-interpretation model (RSIGIM).In so that the Geo-Decision knowledge can be structurally and parametrically fused in. Based on this model we will build the new systematic structure of land-cover/land-use RS classification with the example case in Hong Kong Island by multi-dimensional spatial; data fused between the multi-platform remotely sensed data and ancillary geography data.
Introduction
Land-Cover/Land-use, being the new concept developing with the remote sending technology, has become a crucial item of basic tasks in order to carry through a series of important works, such as the p0rediction of land-use change, prevention of nature disaster, management and plan pf lam -use, protection of environment, etc,. With the more thorough development of remote sensing technology and Geo-Analysis model, using remotely sensed data to monitor the status and dynamical change of land-cover/land-use is become the one of the one of the most rapid, credible and effectual method.
Land-cover and Land-use are two different concepts in its intrinsic signification .Land-cover emphasize particularly on its nature properties and it is the synthetically reflection of various elements in global surface covered with natural body or manual construction. Using remote sensing classification method, whatever used or non\-used covering object in surface can be separated. However, Land-use, emphasizing more on land's social properties, is the output of reconstruction activities that human adopts a serials of biologic, technologic measure to manage and regulate the land chronically and periodically according to determinate economic and social purpose. Thus, land-use is a process of turning natural ecosystem into social ecosystem, and the process is a complicated procedure by the synthetic effect from nature, economy and society. The manner, degree, structure, area distributing and benefit of land-use are not only affected by natural condition nut also restricted by diversified natural, economic and technologic condition, and in sometimes among all factors the social production form is determinant Land-use is the most direct and leading driving factor to the land-cover change.
In carrying out research and application of the land-covert and land-use remote sensing investigation, the uniform classification system is usually built up by combining the two concepts under one system, which is called Remote Sensing Land-Cover/Land-Use classification system. IN this paper, we will initially build the intelligent land-cover/land-use classification system that is supported with the proposed model named Remote Sensing Intelligent Geo-Interpretation Model (RSIGIM) basic on the data fusion among multi-platform remote sensing data, geographical ancillary data and geo-knowledge. The multi-platform remote sensing data includes TN,SPOT-HRV, and the geographical ancillary data include topological data and land-cover/land-use classification methods are reviewed. Then in third part, the RSIGIM will be presented out and its land-cover/land-use classification system also is discussed in this part. The application and output evaluation will be talked about in part four. In the end, we will tine the conclusions and prospects.
Conventional Land-Cover/Land-Use Classification Methods
Conventional land-cover/land-use remote sensing classification methods mainly include traditional classification methods, neural networks based classification methods and symbolic knowledge based logic reasoning classification method .
Traditional Land-cover/Land-use RS Classification
Traditional remote sensing image classification can be classified into rationalization method, hierarchical classification method, decision-tree classification method, and statistical classification method, etc. Every method has its geo-background. For example, rationalization and hierarchical classification, mainly according to the geo-difference rule in remote sensing image, are to step wisely classify the image from sketchy degree to subtle degree to subtle degree by different classification decision rules in different hierarchy, such as the decision tree mode by landscape difference in remote sensing image. These traditional classification method require that the one who want to do classification should master the geo-regularity in the remote sensing image to a sufficient degree, or the outcome is difficult to reflect to reflect the true geo-distribution. Therefore, the limitation to the traditional method is the difficulties to hold the criterion of classification and qualitative component in the method is primary.
Based on mathematical and statistical analysis model, a lot of remote sensing classification and information extraction methods already has been developed The typical methods include ISODATA clustering, minimum distance methods, maximum like classification, etc, which are all based on parametrically or non parametrically statistical distribution model to do the basic processing and analytical process to the remote sensing image by mathematical computing and statistical analysis. With MSC model and the fact that the statistical difference exists between datum in feature space, the primary cognition to the RS image including the basic land-cover unit classification and information extraction can be realized. But for no integrating with geo-knowledge MSC is difficult to truly reflect come special geo-distribution and especially the defect of being difficult to gain the parameters of the parametric model is existing when processing or analyzing the complicated spatial information.
Neural Networks Based Land-Cover/Land-Use Classification
Comparing to the traditional classification methods, artificial neural networks (AQNN)based classification method simulates the human vision and neural processing system to get the cognition to the RS image. Neural-network classifiers are non-parametric and therefore may be more robust when distribution are strongly non-Gaussian. During training, the network to capable of forming arbitrary decision boundaries in the feature space. With distributed knowledge represented in the neural network and the knowledge got by training the priori samples of datum the neural network, can be get complicated and nonlinear mapping ability to realize the land-cover hierarchical classification from coarse degree to subtle degree with scale space changed. Thus, ANN method generally can get more high accuracy of the outcome and have been widely used in land-cover/land-use classification. Especially ANN's superiority is showed to the complicated land type.
Since the publication of Rumellhart and McClelland(1986),there has been a renaissance of interest in using neural network, particularly back-propagation neural networks, for land-cover/land land-use classification. Howald(1989).McClelland (1989), Hepner (1990), T.yoshida(1994),K>S>Chen(1995),J.D.Poala(1997),etc, all used ANN method in the land-cover classification by TM image, and in vary degree the accuracy is improves. Kanellopoulos(1992) used FANN method to classify the land -cover into 20 type with SPOT-HRV image, and its outcome got better accuracy than general statistical method. By ANN method, G.M.Foody(1996) separated the mixed pixel in land-cover. Under the basis of TM remote sensing data, spatial context information data, ancillary information (including DEM and slope), L.Bruzzpne (1997) classified the complicated land-cover using ANN method and 9%improvement in accuracy comparing to the maximum like hood classifier.
Despite its strong non linear mapping ability to processing and analyzing the remote sensing information with complicated spatial distribution, most ANN methods are also just a computing behavior like general computing models. Therefore, ANN method without being supported by geo-knowledge also can nota truly reflect the distribution character of some special type of phenomenon in remote sensing image.
Symbolic Knowledge Reasoning Based Land-Cover/Land-Use Classification
Recently, in the research and application of remote sensing land-cover/land-use classification, the knowledge based logic reasoning classification method or even to build expert system have been carried out and have got fruit progressing. A symbolic knowledge based system may be a large and complex set pf program functioning as an expert system that simulates the higher-order interpretative processes of human analysts When such knowledge representation imitates of simulates the logic of human perception, it is called machine or computer vision.
With the support of symbolic geo-knowledge base, including spectral knowledge base, topological knowledge base and land-use knowledge based, and logic reasoning machine, the classification outcome of land-cover can be validated and modified by obeying to the facts and rules in the realistic land cover and land use distribution. By building the spectral knowledge base, S.W.Wharton(1987)improved the accuracy in urban land-cover classification. B.Kartikeyan (1995) built the frame work of remote sensing land-cover classification expert system including spectral knowledge base, reasoning machine, knowledge automatic acquisition unit, by which the example work land-cover classification cal carried out.
Based on conventional geo-analysis thought of geo-difference in geo-phenomenon, symbolic knowledge based logic reasoning remote sensing classification method realizes the discriminance in remote sensing image by symbolic representing to the geo-knowledge and formalization reasoning machine. Thus, in some degree it can truly reflect the geo-distribution in the remote sensing image. But for the characteristics of RS information being fuzzy and complicated, it is difficult to represent the land-cover regularities and duynami9cal growing process hidden in remote sensing by structural and symbolic geo-knowledge. Further more, for remote sending image generally comprise huge information, the efficiency should nesting site low when using serial symbolic reasoning forms to processing and analyzing the image data.
Remote Sensing Intelligent Geo-Interpretation Modal
In this section, we will propose a classification system named RSIGIM/ Remote Sensing Intelligent Geo-Interpretation Modal (RSIGIM) is a hierarchical processing and analyzing modal to research how to simulate the synthetically Geo-expert's interpretation and decision process to the remote sensing image by computer system. From law level to high level, RSIGIM passes through several courses including information transfers, statistical basic processing and analyzing unit, physiological vision cognition, psychological logic cognition, knowledge discovery, decision and analysis. The process is just like the intelligent interpretation process of an expert to picture from receiving, observation, judgment, association to memory . (Figure1).
Figure 1: The Framework of RS Intelligent Geo-Interpretation Model
There are several targets of to present out the RSIGEM as below.
- To describe, recognize, classify and interpret the geo-object, phenomenon and manner hidden in remote sensing image;
- To extract the imagery mechanism and intrinsic feature including classifying type, size, structure, relationship and others geo-properties of geo-objects in RS image;
- To discover and represent the geo-knowledge from huge accumulated image base;
- And further more, to do prediction and decision to the geo-phenomenon and geo-manner by being integrated by certain geo-analysis model.
Figure 2 Systematic Structure of land -cover classification based on RSIGIM
Example Application
Study sites and Data
Our study area is located at Hong Kong Island, where is south of Hong Kong Region, in southern china. (Figure 3). In this area, the status of topography is very steep and mountainous. Urban area distributes along the fringe of the island, where mainly is dependent to the filling sea to increase the urban region since the first exploring to this land one hundred and fifty years ago.
Figure 3 Study Area in Hong Kong Administration Map.
The data in this experiment includes Remote sensing data and ancillary geographical data. Land-sat TM imagery flown on 3 March 1996 and SPOT-HRV imagery flown on 2 February 1999 were available for the study. The ancillary geographical data is DEM data and its byproducts including slope and aspect data. The land-use map finished by experts vision interpretation also is used in validation and updating to the land-use by land-cover classification outcome by building land-use knowledge base. Figure is the 3D- display image effect of Hong Kong Island, which is overlaid by TM 5,4,3 band colored with Red, Green and Blue respectively. Figure 5 is SPOT HRV imagery covered on Hong Kong Island.
Figure 4 3D display of HK Island overlaid by TM 5,4,3 with R,G,B color.
Figure 5 SPOT-HRV covered in Hong Kong Island (2 Feb. , 1999)
With basis on the vision interpreting to the remote sensing image in Fig. 4,5, we can find out that in Hong Kong Island the land-cover type is very complicated and anfractuous for its steep topography and sinuous distribution of urban region. By multi-platform remote sensing image data and synthetical analysis methods to investigate the status of land-cover/land-use will provided us punctual, dynamical and fast validation and updating information to the advanced land decision and planning is such an urban region. Based on RSIGIM model in this work, we have designed a hierarchical classification system to Hong Kong Island land-cover/land, which is also divided into three levels corresponding with the structure of RSIGIM. Level one is the preprocessing to the spatial data in order to enhance information or do basis preparing works for next stage. Level two is to do the coarse to subtle classification under the RS data sources from the TM to SPOT with supported by suitable neural computing algorithms. Level three is to validate and update the landuse with supported by geo-knowledge processing system under the classifying outcome in level two.
Preprocessing to the spatial data
With supported by the first level of RSIGIM, preprocessing to the spatial data is necessary for doing the basis processing works in order to be prepare for next higher cognition process or enhance the effect of the vision of RS image. The preprocessing process mainly should include image enhancement, geometric correction, statistical transformation, etc. For instance, in this sample, the main preprocessing works for land-cover classification is done as below.
- Geometric correction. Because of the spatial data being acquired from multi-platform its objection system and spatial resolution may be different, then before doing classifying the geometric correction work should be done. The first step of correction is to select the control points from image at the distinct sites in image, such as at reflection of the edge of shore, intersection point of roads, peak of hill, building and bare point.
- Principal Component Analysis (PCA),or K-L transformation . In the multi-spectral RS image, correlative degree often exists between bands of image. We can use minimum bands to represent the most information in whole bands after PCA to the original bands .
- DEM preprocessing. The most important restriction to regional differences of land-cover type is from topographical element like altitude, slope roughness and aspect. In the preprocessing process of land-cover classification system, these topological elements can be derived from only DEM data. By these topological elements being added into the classification system with support by topological knowledge base, the accuracy can be improved with great degree and of uncertainty of spatial data can be reduced.
- Mathematical and Statistical Clustering. Before classifying, using all multi-spatial RS data to do clustering analysis in order to make known the complicated degree of the study area is important and necessary. This process can let us comprehend the probable land-cover distribution by RS data without considering the accuracy. The typical clustering methods include K-means, ISODATA and ART, etc. Fig 6 is the output of clustering by method of scale space based hierarchical clustering algorithm which is based on simulating annealing theory.
Figure 6 Classification Map by Clustering Method
Geo-knowledge Processing
The geo-knowledge in general RS land-cover /land-use classification system mainly includes:
- Spatial Knowledge to describe the manner of classifying types.
- Vegetation Index: to reveal the vegetation information by index computing model, such as normalized difference vegetation indices, which is calculated from the red and near- infrared bands.
- Distribution manner with the topological element : including the altitude distribution manner, slope distribution manner and aspect distribution manner;
- Spatial Relationship; to describe the relationship between object in image space..
- Temporal distribution and growing manner. For instance, the vegetation index change with the transition of seasons.
Coarse classification by TM imagery
In the coarse classification, the spatial data includes TM remote sensing data and topological data. There- into TM data includes 4 bands (TM123,CH4,CH5,CH7), in which TM123 is the first component of PCA transformation to the visible bands (CH1, CH2 ,CH3) Topological element include altitude, slope and aspect data. The main process of coarse classification under these spatial data is described as below. After geometric correction the size of data matrix is row 400 by column 540, which covers the whole island
- Determination of the main land cover types. Firstly, the complicated degree is acquired by using clustering degree is acquired by using clustering method to do cluster analysis (fig6), then from clustering map the first layer of classification type in decision tree is determined. IN this example, we use Scale Space based hierarchical classification algorithm to do cluster, and after then 5 main land-cover is determined, including: Water Body Land (C3), Forest (c4) Forest, Grass(c5).
- Automatic Geo-Knowledge Acquisition from image. Usally, in
conventional intelligent system the knowledge acquisition is directly
read from area expert according to his common sense, experience by
manual symbolization procedure and means. But in fact, besides the
knowledge from expert, a great deal of others knowledge is hidden in
huge data base, and it may can not easily dug out by general method and
is so dynamical and uncertain that even is similar with them. In RSIGIM,
we have proposed a new method, named step wisely Optimization Making
Model (SOMM) based on Genetic Algorithm Optimization Theory, to find
spatial knowledge automatically from spatial data based on Gausian
Mixture Density Modeling and Decomposition theory (GMDD). The procedure
of SOMM is described as figure 7. By SOMM method, we could build
knowledge base with TM spectral knowledge and topological knowledge, all
of which are represented with RULE-"IF-THEN" format.
Figure 7 SOMM-GA Optimization Model
The rule is represented with fuzziness. The fuzziness of rule is represented as Figure 8. In the area of value, give 4 values: A,B,C,D. If x is in A to B, the certainty of x to the rule is give from 0.0 to 1.0 with linear raising. If x is in B to C, the certainty is 1.0, and if x is in C to D, the certainty is give from 1.0 to 0.0 in linear falling.
Figure 8 The Representation of fuzziness in rule
For example, the form of geo-knowledge is organized in knowledge base as below.- TM spectral knowledge Base (PCA123, CH4, CH5, CH7):
If((((pcal 23>= 37..36, 38.36) and (pcal 123<= 39.36, 40.37)) {CF>=0.5}) and (((ch4>= 12.46, 15.46) and (ch4<=18.46, 21.47)) {CF>=0.5}) and (((ch5>= 2.35, 5.36) and (ch5<= 8.37, 11.37)) {CF>=0.5}) and (((ch7>= 0.00, 2.43 ) and (ch7<=4.94, 7.44)) {CF>=0.5})) then id is C2) Certainty is very_close_to0.92.
If((((pcal 23>=42.46, 43.46) and (pcal 23<= 44.46, 45.46)) { CF>=0.5 }) and (((ch4>= 17.15, 17.65) and (ch4<= 18.15, 18.66)) {CF>=0.5}) and (((ch5>= 4.93, 7.43) and (ch5<= 9.94, 12.45)) {CF>=0.5 }) and (((ch7>= 5.14, 5.65 and (ch7<=6.15, 6.65)) {CF>=0.5})) then id is C2) Certainty is very_close_to 0.62.
- Topological knowledge Base (DEM, SLOPE, ASPETCT):
If ((dem = 0.0, 0.0. 0.02, 0.03 {CF>= 0.400000}) and (slope= 0.0, 0.0, 0.0, 0.0 {CF>= 0.400000})) then id is Cl Certainty is very_close_to 0.95.
If ((dem= 329.710000, 329.730000, 329.730000, 329.760000, 329.770000 }CF>= 0.400000}) and (slope = 24.840000, 24.850000, 24.850000, 24.850000 {CF>= 0.400000})) then id is c5 --- Certainty is very_close_to0.54.
If ((dem= 0.000000, 0.000000, 30.060000, 53.710000 {CF>= 0.400000}) and (slope = 0.000000, 0.000000, 13.520000, 23.270000 {CF>= 0.400000})) then id is c2 --- Certainty is very_close_to 0.95.
If ((dem= 0.000000, 2.020000, 6.550000, 8.810000 {CF>= 0.400000 }) and (slope=1.000000, 1.380000, 2.130000, 2.510000 {CF>= 0.400000})) then id is c3 --- Certainty is very_close_to 0.73.
If((dem = 0.000000, 85.790000, 359.570000, 496.460000 { CF>=0.400000}) and (slope= 0.880000. 17.380000, 50.380000, 66.890000 {CF>= 0.400000})) then id is c4 --- certainty is very_close_to 0.95.
- TM spectral knowledge Base (PCA123, CH4, CH5, CH7):
- Knowledge based RBF land-cover classification. With supported by knowledge base, we use RBF (Radial Basis Function) neural network to classify the main land cover. Generally, BP neural network is most pervasive in land-cover classification, but it exist some unavoidable defects, such as slow training speed, unable to converge for fall into local minimum, and difficult to determine the structure of network, etc. In order to overcome these difficulties, some new types of neural networks have been prompted out in recent years. Among them, the typical models are RBF neural network and ARTMAP model.
Figure 9 RBFNN Remote Sensing Image Classification Flow.
In this sample, we firstly select 1000 samples with prior knowledge from the TM image with help of vision interpretation to training the RBFNN. After training, the vectors from image are fed into RBFNN pixel by pixel, and by passing through in network the classifying belief vector m1 is outputted in output layer. Simultaneously, the spatial vector also is inputted into reasoning machine to output the another classifying belief vector m2. By D-S evidential reasoning method the overall belief vector m can be got by m1+m2, and in the vector m2 choosing the maximum dimensional value as the classification type. Figure 10 is the outcome of classification. We select 500 test samples at random sites in image to test the accuracy of methods. Table 1,2,3 respectively is the error matrix of conventional statistical maximum likelihood classifier, RBFNN with rule supported and with no-rule supported. We can find that RBFNN can get more high accuracy while keeping high training efficiency comparing to traditional statistical classifier.
Figure 10 Land-Cover Classification by neural nerwork method based onTM and knowledge base
| C1 | C2 | C3 | C4 | C5 | Total | |
| C1 C2 C3 C4 C5 TOTAL |
81 19 0 0 1 100 |
5 86 2 0 7 100 |
0 0 99 0 1 100 |
0 0 0 98 2 100 |
1 2 2 6 91 100 |
87 107 103 104 101 500 |
| C1 | C2 | C3 | C4 | C5 | Total | |
| C1 C2 C3 C4 C5 TOTAL |
95 4 0 1 0 100 |
2 96 0 1 1 100 |
0 0 99 0 1 100 |
0 0 0 100 0 100 |
0 3 1 2 94 100 |
97 103 100 104 96 500 |
| C1 | C2 | C3 | C4 | C5 | Total | |
| C1 C2 C3 C4 C5 TOTAL |
95 5 0 0 0 100 |
1 97 0 1 1 100 |
0 0 100 0 0 100 |
0 0 0 99 1 100 |
0 2 1 2 95 100 |
96 104 101 102 97 500 |
Subtle Land-Cover classification by SPOT HRV imagery
After coarse classification to get the main land-cover map under TM data, every type is fused with SPOT-HRV data to form into second subtle distribution structure. Then using ARTMAP method the second layer of subtle classification map can be acquired also with supported by topological and spectral knowledge base.
Adaptive Resonance Theory (ART) networks (Carpenter and Grossberg 1988) are most useful for clustering analysis, classification and recognition. The ART suggests a solution to the stability-plasticity dilemma during the designing of learning systems. Fuzzy ARTMAP has been proposed by Carpenter et al. (1991) as a direct generalization of ARTMAP for supervised learning of recognition categories and multi-dimensional maps in response to arbitrary sequences of continuos-valued patterns not necessarily interpreted as fuzzy set of features. Fuzzy-ARTMAP synthesizes fuzzy logic and ART models by describing the dynamics of ART category choice, search and learning in terms of analog fuzzy set-theoretic rather than binary set-theoretic operations. Fuzzy-ARTMAP is designed to solve supervised dimensions, where mapping is learned by example from pairs (A,B) of sequentially presented input and output vectors. The ARTMAP system incorporates two ARTI modules, respectively.
On the basis of the first classifying layer of TM, the second classifying layer can be divided into 10 land-cover type as listed in Figure 11. Table 4, Table 5 and Table 6 respectively is the error matrix by conventional BPNN, ARTMAP and symbolic knowledge based ARTMAP method. We can find that ARTMAP and knowledge based ARTMAP method can get more high accuracy while improving the training efficiency. Figure 12 is the outcome of subtle land-cover classification by SPOT HRV image supported by Knowledge base.
Figure 11 The Second Layer of Land-Cover Classification strategy
Figure 12 Land-Cover Classification by neural network method based on Based on SPOT and knowledge base
| C1 | C2 | C3 | C4 | C5 | C6 | C7 | C8 | C9 | C10 | Total | |
| C1 C2 C3 C4 C5 C6 C7 C8 C9 C10 TOTAL |
69 22 1 2 1 1 0 4 0 0 100 |
9 72 3 5 0 0 0 10 0 1 100 |
6 1 18 13 44 8 1 1 0 8 100 |
3 10 11 24 29 2 10 3 2 6 100 |
0 2 6 5 66 10 8 0 0 3 100 |
0 0 0 0 17 56 27 0 0 0 100 |
1 0 6 0 1 0 90 6 3 0 100 |
0 0 0 0 0 0 0 100 0 0 100 |
1 0 1 1 1 0 14 42 40 0 100 |
0 0 0 19 2 0 1 21 0 57 100 |
89 107 46 69 161 77 151 186 45 75 1000 |
| C1 | C2 | C3 | C4 | C5 | C6 | C7 | C8 | C9 | C10 | Total | |
| C1 C2 C3 C4 C5 C6 C7 C8 C9 C10 TOTAL |
69 25 1 1 1 1 0 1 1 0 100 |
3 88 2 4 0 0 0 0 0 3 100 |
3 5 26 32 13 12 0 1 1 7 100 |
0 15 13 44 5 5 3 4 1 10 100 |
0 2 19 25 31 8 6 0 5 4 100 |
0 0 1 0 9 68 22 0 0 0 100 |
0 0 1 2 0 4 84 5 4 0 100 |
0 2 0 0 0 0 0 90 0 8 100 |
0 1 0 5 0 0 1 21 67 5 100 |
0 0 0 10 0 0 0 0 0 90 100 |
75 138 63 123 59 98 116 122 78 127 1000 |
| C1 | C2 | C3 | C4 | C5 | C6 | C7 | C8 | C9 | C10 | Total | |
| C1 C2 C3 C4 C5 C6 C7 C8 C9 C10 TOTAL |
94 1 2 1 0 1 0 0 0 0 100 |
1 88 2 6 1 0 0 1 0 1 100 |
4 3 52 26 0 6 0 1 1 7 100 |
3 15 16 48 4 4 1 4 0 5 100 |
0 2 21 30 34 4 5 0 0 4 100 |
0 0 2 1 0 96 1 0 0 0 100 |
0 1 2 0 0 6 79 5 7 0 100 |
0 2 0 0 0 0 0 94 0 6 100 |
0 1 2 4 0 0 1 14 76 2 100 |
0 0 0 8 0 0 0 0 0 92 100 |
102 111 99 124 39 117 87 119 84 117 1000 |
Validation and updating to Land-use
In the end, compared to the land-use map acquired from expert vision interpretation and with supported by ancillary geo-knowledge the validation and updating to the land-use can be achieved. But firstly we should know that there exist difference in classification rule between land-cover and land-use as discussed in previous section. For instance, the public land-use and greenbelt, residents in land-cover are in some degree interlaced. Because these really exists limitation for remote sensing land-cover classification for the feature of uncertainty and fuzziness of remote sensing information that result in impossibly distinguishing all land-cover type just using Remote Sensing data. Therefore, the ancillary knowledge is necessary on invalidating and knowledge base is also organized by RULE format. As below some items of rule are listed. Figure 13 is the outcome of the land-use map invalidated and updated from land-cover classification map.
Figure 13 The Land-Use Validation and Updating Map from land-Cover classification.
If ((cls<=1.000000) and ((land>= 71.000000) and (land<=79.000000))) then id=abs (land)
If ((land=11) or (land = 12 )) and (cls=1) then id=71
If ((land=11) or (land = 12 )) and (cls=2) then id=41
If ((land=11) or (land = 12 )) and (cls=3) then id=42
If ((land=11) or (land = 12 )) and (cls=4) then id=62
If ((land=11) or (land = 12 )) and (cls=5) then id=91
If ((land=11) or (land = 12 )) and (cls=6) then id=91
If ((land=11) or (land = 12 )) and (cls=7) then id=91
If ((land=11) or (land = 12 )) and (cls=8) then id=abs(land)
If ((land=11) or (land = 12 )) and (cls=9) then id=24
If ((land=11) or (land = 12 )) and (cls=10) then id=31
If ((land>=21) and (land< =25 )) and (cls=1) then id=72
If ((land>=21) and (land< =25 )) and (cls=2) then id=41
If ((land>=21) and (land< =25 )) and (cls=3) then id=42
If ((land>=21) and (land< =25 )) and (cls=4) then id=62
If ((land>=21) and (land< =25 )) and (cls=5) then id=91
If ((land>=21) and (land< =25 )) and (cls=6) then id=91
If ((land>=21) and (land< =25 )) and (cls=7) then id=91
If ((land>=21) or (land <=25 )) and (cls=8) then id=abs(land)
If ((land>=21) or (land <=25 )) and (cls=9) then id=abs(land)
Summary and Conclusions
A long term's goal of our studies is to develop models for integrated spatial data and spatial Geo-analysis model with Geo-knowledge model. In this paper, we firstly proposed the RSIGIM model for remote sensing intelligent cognition. RSIGIM is a hierarchical model with three levels of models and methods. All of these three levels of model and methods applied in realistic classification and information extraction need geo-knowledge and ancillary information being fused in, but differences exist in fusing mode and degree.
Mathematical and statistical classification (MSC) model is based on parametrically and non-parametrically distribution model to do the basic processing and analytical process to the remote sensing image by mathematical computing and statistical analysis. With MSC model and the fact that the statistical difference exists between datum in feature space, the primary processing and cognition to the remote sensing image can be realized.
Neural computation theory based classification (NCC) model simulates the human vision and brain neural processing system to get the cognition to the RS image. With distributed knowledge represented in the neural network, and the knowledge got by training the priori samples of datum, the neural networks can be get complicated and nonlinear mapping ability to realize more complex classification and extraction from coarse degree to subtle degree.
The third is symbolic logic reasoning classification (SLRC) model. With the support of symbolic geo-knowledge base, including spectral knowledge base, topological knowledge base and land-use knowledge base, and logic reasoning machine, the classification outcome can be validated and modified by obeying to the facts and rules in the realistic land cover and land use distribution. Aiming at the land-use map from manual interpretation to the RS photo, updating and decision can be arrived in some degree.
After we outline the RSIGIM model, the basic intelligent land-cover/land-use classification framework and technology system based on RSIGIM is proposed out, by which the process and procedure of land-cover/land-use classification in Hong Kong Island are described and the outcome is evaluated.
Acknowledgements:
The authors would like to thank Prof. Yee Leung of Chinese University of Hong Kong for kindly advice on some algorithms of neural networks and cooperation on the developing the geo-Expert System Software. The authors wish to thank Dr. J.H. Gong and Dr. Hui Lin for helpful suggestions and comments.
References:
- Atkinson, P.M., A.R.L. Tatnall, 1997, Neural Networks in remote sensing, INT. J. Remote Sensing , 18(4):699-709.
- Benediktsson, J.A., P.H. SWAIN, and O.K. ERSOY, 1990, Neural Network approaches versus statistical methods in classification of multi-source remote sensing data. IEEE Trans. On Geo-Science and Remote Sensing, 28 (4):540-552.
- Bischof, H., W. Schneider, and A.J. Pinz, 1992, Multi-spectral classification of Landsat images using neural networks. IEEE Transactions on Geo-Science and Remote Sensing, 30(3): 482-490.
- Bruzzone, L., C. Conese, F. Maselli and F. Roli, 1997, Multi-source Classification of Complex Rural Areas by Statistical and Neural Networks approaches, Photogrammetric Engineering & Remote Sensing, 63(5): 523-533.
- Chen, K.S., Tzeng, Y.C., Chen, C.F., and Kao, W.L. 1995, Landcover classification of multi-spectral imagery using a dynamic learning neural network, Photogrammetric Engineering and Remote Sensing, 61(4): 403-408.
- CIVCO, D.L. 1993, artificial neural networks for land-cover classification and mapping, INT. J. Geographical Information Systems, 7(2): 173-186.
- Flygare, A.M., 1997, A Comparison of contextual classification methods using Landsat TM, INT. J. Remote Sensing, 18(8): 3835-3842.
- Foody, G.M., 1996, Relating the Land cover Composition of Mixed Pixels of Artificial Neural Network Classification Output, Photogrammetric Engineering & Remote Sensing, 62[5]: 491-499.
- Foschi, P.G., and Deborah K. Smith, 1997, Detecting Sub pixel Woody Vegetation in Digital Imagery Using Two Intelligence Approaches, Photogrammetric Engineering and Remote Sensing, 63(5): 493-500.
- Friedl, M.A., and C.E. Brodley, 1997, Decision Tree Classification of Landcover from Remotely Sensed Data, Remote Sensing of Environment, 61: 399-409.
- Fung, T. and K.C. Chan , 1994, "Spatial Composition of Spectral Classes: A Structural Approach for Image Analysis of Heterogeneous Land Use and Land Cover Types", Photogrammetric Engineering and Remote Sensing, 60(2): 173-180.
- G.A Carpenter, Martin N. Gjaja,S. Gopal, and C.E. Woodcock, ART Neural Networks for Remote Sensing Vegetation Classification from Landsat TM and Terrain Data, IEEE Transactions on Geo-science and Remote Sensing , Vol. 35, No.2, March, m1997, pp.308-325.
- Gong, P., 1996, Integrated Analysis of Spatial Data from Multiple Source: Using Evidential Reasoning and Artificial Neural Network Techniques for Geological Mapping, Photogrammetric Engineering & Remote Sensing, 62(5). 513-523.
- Gong, P., R. Pu and J. Chen, 1996, Mapping Ecological Land Systems and Classification Uncertainties from Digital Elevation and Forest-cover Data Using Neural Networks, Photogrammetric Engineering & Remote Sensing, 62(11): 1249-1260.
- Kartikeyan, B., K.L. Mahumder, and A.R. Dasgupta, 1995, An expert system for land cover Classification, IEEE Transactions of Geosciences and remote sensing, 33(1) : 59-66.
- Kimes, D.S., P.R. Harrison, P.A. Ratcliffe, 1991, A knowledge-based expert system for inferring vegetation characteristics, 12(10): 1987-2020.
- Paola, J.D., and R.A. Schowengerdt, 1997, The Effect of Neural Networks Structure on a Multi-spectral Land-use/Land-Cover Classification, Photogrammetric Engineering & Remote Sensing, 63[5]: 535-544.
- Paola, J.D.a nd R.A Schowengerdt, 1995, A review and analysis of back-propagation neural networks for classification of remotely sensed multi-spectral imagery, INT.J. REMOTE SENSING, Vol. 16, 3033-3058.
- Peddle, D.R., 1995, Knowledge Formulation for Supervised Evidential Classification, Photogrammetric Engineering and Remote Sensing, 61(4): 409-417.
- R. Rollet, G.B. Benie, W. Li. S. Wang, Image Classification a algorithm based on the RBF neural network and K-means, INT. J. Remote sensing, 1998, Vol.15, pp.3003-3009.
- S. Grossberg, "Adaptive pattern classification and universal recoding, II: Feedback, exception, olfaction, and illusions, Biolog. Cybernet., Vol.23, pp.187-202, 1976.
- Stephon I. Gallat, 1992. Neural Network Learning and Expert Systems, The MIT Press Skidmore, A.K., B.J. Turner, W. Brinkhof, and E. Knowles, 1997, Performance of a Neural Network: Mapping Forests Using GIS and Remotely Sensed Data, Photogrammetric Engineering and Remote Sensing, 63(5): 501-514.
- Skidmore, A. K., F. Watford, P. Luckananurug, and P.J. Ryan, 1996, An Operational GIS Expert System for Mapping Forest Soils, Photogrammetric Engineering & Remote Sensing, 62(5): 501-511.
- Timothy, A. Warner and Micheal Shank, 1997, An Evaluation of the Potential for Fuzzy Classification of Multi-spectral Data Using Artificial Neural Networks, Photogrammetric Engineering and Remote Sensing, 63(11): 1285-1294.
- Ton, J., J. Sticken, and A.K. Jain, 1991, Knowledge-Based Segmentation of Landsat Images, IEEE Transactions on Geo-Science and Remote Sensing, 29(2): 222-232.
- Whartson, S.W., 1987, A Spectral-Knowledge-based Approach for Urban Land-Cover Discrimination, IEEE Transactions on Geo-Science and Remote Sensing, GE-25(3): 272-282.
- Yee Leung, 1997, Intelligent Spatial Decision Support Systems, Advances in Spatial Science, Springer.
- YOSHIDA, T., and OMATUS, S., 1994, Neural Network approach to land cover mapping, IEEE Transactions on Geo-Science and Remote Sensing, 32(5): 1103-1109.