| GISdevelopment.net ---> AARS ---> ACRS 1999 ---> Image Processing |
Fuzzy Training Data for Fuzzy
Supervised Classification of Remotely Sensed Images
Chi-Farn Chen
Center for space Remote Sensing Research
National Central University
Chung Li, China Taipei
Tel: 886-3-4227151-7624, Fax:886-3-4254908
Email: cfchen@csrsr.ncu.edutw
AbstractCenter for space Remote Sensing Research
National Central University
Chung Li, China Taipei
Tel: 886-3-4227151-7624, Fax:886-3-4254908
Email: cfchen@csrsr.ncu.edutw
This paper describes a supervised fuzzy approach for the classification of remotely sensed images. Conventionally, the computer-assisted supervised classification requires sufficiently homogenous training data to perform the multi-spectral image classification. However, such a requirement is not feasible for the image with highly complex surface features. Moreover, the traditional classification mapping with one-pixel-to-one-class algorithms normally fail to deal with the mixed the pixels that ordinary caused by the mixture of landcover classes. This study attempts to develop a surprised fuzzy approach to train the selected data and classify the images. The algorithm consists of two major steps: (1) the estimate of fuzzy parameters from training data, and (2) the fuzzy classification of the images. The fuzzy approach of the training data allows the of the training data. The following fuzzy classification will then tackle the mixed pixel problem that allows every pixel has a membership value between 0 and 1 for every candidate class. The method is applied to the classification of multi-spectral images obtained from the simulated method and SPOT satellite. A qualitative comparison demonstrates that both original images and the classified maps are visually well matched. A further quantitative analysis indicates that the resultant overall accuracy of above 90% can be found for both simulated and SPOT images. The visual comparison and the high accuracy scores demonstrate the potential application of the proposed fuzzy supervised classification to the remote sensing images with highly complex and greatly fuzzy land cover.
Introduction
The classification approach has been successfully applied to the analysis of remote sensing image for the past two decades. The computer-assisted classification techniques can be conventionally grouped into two broad categories: supervised or unsupervised approach [1]. Traditionally, both approaches generate one-pixel-to-one-class mapping. However, such an approach clearly is becoming more difficult as the areas of interest contain a mixture of landcover classes. The complex land surface often causes the mixed pixels in the remote sensing image if the image pixel size is not fine enough to catch the spectral response from only a single land class. For example, a mixed pixel may contain the spectral responses from both grass and underlying soils. Fuzzy classification has been used to deal with mixed pixel problem that allows every pixel has a membership value between 0 and 1 for every candidate class. In the classification of remote sensing images, Bezdek et al [2] developed a fuzzy c-means clustering algorithm to perform an unsupervised classification. Wang [3] proposed a supervised mode for fuzzy classification. Mannan et al [4] applied fuzzy neutral networks to the classification of multi-spectral images. Foody et al [5] found that the fuzzy membership values for each cover class strongly correlate with the actual ground proportions of those land cover classes.
In this study, a fuzzy supervised classification is used to classify multi-spectral images. Traditionally, the supervised classification methods rely on the assumption that the training sites must be relatively homogenous. However, this assumption is not often valid in the areas with highly complex land surface. Moreover, the mixed pixels may cause the significant fuzziness in the training data. Therefore, this study focuses on developing the fuzzy parameters for training data. Then the fuzzy training data is used by the following fuzzy classification.
Method
The fuzzy supervised classification used in this study consists of two major steps: (1) the estimate of the fuzzy parameters from training data, and (2) the fuzzy classification of the images.
The fuzzy parameters of training data
At this step, the conventional mean and covariance parameters of training data are represented as a fuzzy set. The following two equations (Equ.1 and Equ.2) describe the fuzzy parameters of the training data:
where mc* is the fuzzy mean of training class c, åc* is the fuzzy covariance of training class c, xi is the vector value of pixel i, fc(xi) is the membership of pixel xi to training class c, n is the total number of pixels of the training data.
In order to find the fuzzy mean (Equ.1) and fuzzy covariance (Equ.2) of every training class, it must know the membership of pixel xi, to training class c first. In thus study, the membership function is defined based on the conventional maximum likelihood classification algorithm with fuzzy mean and fuzzy covariance.
Where fc(xi) is the membership of pixel xi, to class c, Pc*(xi) if the maximum likelihood probability of pixel xi, to class c, m is the number of classes, n is the number of the bands.
As long as the membership values of each training pixel are known, the fuzzy mean and fuzzy covariance of the training data can be calculated according to Equ.1 and Equ.2. However, the calculation of the membership values requires knowing the fuzzy mean and fuzzy covariance in advance (Equ. 3). Therefore, this generates a catch-22 situation - without knowing membership values it can not get fuzzy mean and fuzzy covariance and without knowing fuzzy mean and fuzzy covariance it can not get membership values. In this study, an iterated algorithm is used to generate the membership values of the training data. At the initial state, the membership values are assumed to be either 0 or 1 for each training class, namely, no fuzziness exists in the training data. Then the convectional mean and covariance according to Equ.1 and Equ.2 are calculated for each training class. Accordingly, the new membership values will be calculated (Equ. 3) from this convectional mean and covariance. The new membership values will then feedback to calculate fuzzy mean and fuzzy covariance. The process will repeat until all fuzzy means reach a stable state. This iterated process would ultimately produce the fuzzy mean and fuzzy covariance for each training class.
The fuzzy classification of the image
As long as the necessary fuzzy mean and fuzzy covariance of each training class are calculated from the procedures described at the previous section (2.1), a fuzzy supervised classification can be implemented on a multi-spectral remotely sensed image. Accordingly, the membership values of each pixel calculated from Equ.3 can be used to generate a thematic class map.
Test Data and Results
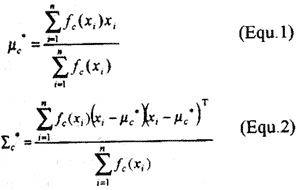
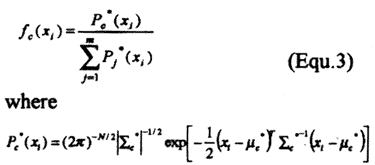
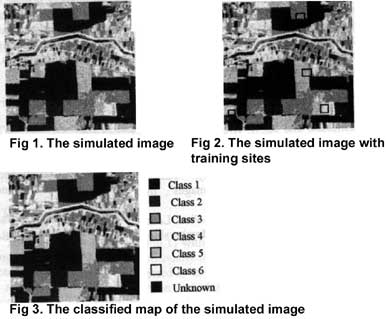
In this study, a simulated image (Fig.1) with three bands is generated for algorithm testing. The training sites are selected manually for each class in this testing (Fig. 2). It is noted that some training sites are selected to cover two classes on purpose. By doing this, a training site may contain more than one class and create the fuzzy situation for training data. The fuzzy classification result can be found in Fig. 3. The visual comparison between the original image (Fig. 1) and the classified image (Fig. 3) indicates that the proposed fuzzy supervised classification can produce a fairly representative thematic map (Fig.3). the quantitative analysis and the resultant overall accuracy of 99.5% can be found in the error matrix table (Table 1). The excellent performance of the fuzzy supervised classification using the simulated image can be demonstrated from this very high classification accuracy.
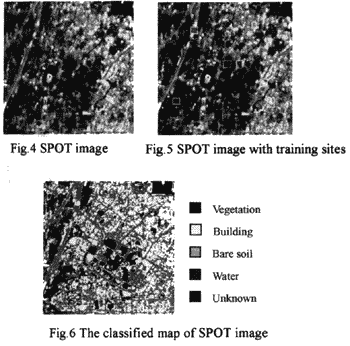
A SPOT multi-spectral image (Fig.4) is used for testing the real application. The image (256*256 pixels) is acquired from SPOT satellite and its corresponding test site is located near Taichung City. The site and its surrounding areas include urban and suburban region where the major land cover comprises the mixture of building, vegetation, bare soil, and water. The land classes appeared in this image show a fairly complex mixture that obviously supervised will create a big challenge to select the homogenous training site for the convectional supervised classification. However, since the proposed fuzzy supervised classification is able to deal with the fuzzy training data, it is acceptable to select the training sites in the area with highly complex landscapes that generally involves more than one land cover classes (Fig. 5). The resultant classified image is shown in Fig. 6. The comparison demonstrates that both original image (Fig. 4) and classified map (Fig. 6) are visually well matched. An accuracy assessment of the classified result produces an error matrix (Table 2). The overall accuracy of 89.5% is obtained. This high accuracy score demonstrates the potential application of the fuzzy supervised classified to the remote sensing images with highly complex and greatly fuzzy land cover.
Conclusion
A fuzzy supervised classification method for remotely sensed imagery is proposed in this study. The main use of the method is applied to the images that have the difficulty to select the homogenous training sites. The key step of the method is to estimate the fuzzy mean and fuzzy covariance of the training data. The fuzziness of the training data allows the classified pixels can be presented in the form of membership values, and, therefore, produce more accuracy results.
References
- T.M. Lillesand and R.W. Kiefer "Remote Sensing and Image
Interpretation" , 3rd edition, 1994.
- J.C. Bezdek, R. Ehrlich, and W. Full, "FCM: The Fuzzy C-Mean
Clustering Algorithm", Computers, and Geosciences, 10, pp. 191-203,
1984.
- F. Wang, "Fuzzy Supervised Classification of Remote Sensing Images",
IEEE Transactions on Geosciences and Remote Sensing, vol. 28, no. 2, pp.
194-201, 1990.
- B. Mannan, J. Roy, and A.K. Ray, " Fuzzy ARTMAP Supervised
Classification of Mulit-spectral Remotely-sensed Images", Int. J. Remote
Sensing, vol. 19, no. 4, pp. 767-774, 1998.
- G.M. Foody, and D.P. Cox, "Sub-Pixel Land Cover Composition
Estimation Using a Linear Mixture Model and Fuzzy Membership Functions",
Int. J. Remote Sensing, vol. 15, no. 3, pp. 619-631,
1994.
Table 1 The error matrix of the simulated image
| Classification | Ground Truth | ||||||
| 1 | 2 | 3 | 4 | 5 | 6 | Total | |
| Unknown | 25 | 44 | 36 | 1 | 0 | 0 | 106 |
| 1 | 17307 | 28 | 0 | 0 | 0 | 0 | 17335 |
| 2 | 67 | 6984 | 25 | 0 | 0 | 0 | 7076 |
| 3 | 0 | 62 | 15740 | 2 | 0 | 0 | 15804 |
| 4 | 0 | 0 | 6 | 12436 | 0 | 0 | 12442 |
| 5 | 0 | 0 | 0 | 0 | 7837 | 0 | 7837 |
| 6 | 0 | 0 | 0 | 0 | 0 | 5449 | 5449 |
| Total | 17399 | 7118 | 15807 | 12439 | 7837 | 5449 | 66049 |
| Overall Accuracy 99.55% | |||||||
| Kappa Coefficient 0.9944 | |||||||
Table 2 The error matrix of the SPOT image
| Classification | Ground Truth | ||||
| Vegetation | Building | Bare soil | Water | Total | |
| Vegetation | 93 | 2 | 4 | 11 | 110 |
| Building | 0 | 179 | 21 | 0 | 204 |
| Bare soil | 5 | 17 | 275 | 6 | 303 |
| Water | 0 | 0 | 5 | 95 | 100 |
| Total | 98 | 198 | 305 | 103 | 717 |
| Overall Accuracy 89.54% | |||||
| Kappa Coefficient 0.8507 | |||||