| GISdevelopment.net ---> AARS ---> ACRS 1999 ---> Hyper Spectral Image Processing |
Pattern decomposition Method
for Hyper-multispectral Satellite Data Analysis
Noboru Fujiwara*, Motomasa
Daigo** and Rika Urabe*
*Department of Information and Computer Sciences
Nara Women's University
Nara 630-8506, Japan
E-mail: fujiwara@ics.nara.wu.ac.jp
**Faculty of Economics, Doshisha University
Kyoto 602-8580, Japan
Abstract*Department of Information and Computer Sciences
Nara Women's University
Nara 630-8506, Japan
E-mail: fujiwara@ics.nara.wu.ac.jp
**Faculty of Economics, Doshisha University
Kyoto 602-8580, Japan
Recently, we have developed a new analysis method for multi-spectral satellite data called " Pattern Decomposition Method" based on linear mixing of three universal spectral pattern of ground objects, namely water, vegetation and soil. In this method, the spectral reflectance of each pixel in a satellite image is decomposed into the three components. We study the application of the method to continuos spectra of ground objects and the relationship between the method and the principle component analysis method in terms of information transformation. The continuous spectral reflectance of land cover objects in the 350-2,500 nm wavelength band could be decomposed by the universal spectral patterns and 95% of the information of the spectral reflectance is transformed on average. This result is very important general rule for analyzing the hyper-multispectral satellite data. Mixing ratio of land cover objects in a pixel could be evaluated with good accuracy using the linear mixing three decomposition coefficients.
1. Introduction
Reflecting the process of technology, recent satellite sensors can provide hyper multi-spectral data. Several analysis methods have been developed for these data. The methods are generally classified into two groups. One is the class of principle components transformation [Gonzalez 1997, Merembeck and Turner 1980]. The principle component analysis method is mathematically pleasing, but the new coordinate system have no physical meaning. The other is spectral mixing analysis (end members method) [Adams et. Al. 1995]. In this analysis, the spectrum of each pixel is approximated as the linear sum of a spectrum for each classification category. The coefficients of that linear sum express the belongings ratios of each pixel to those categories.
We have developed a new analysis method for multi-spectral satellite data called the "Pattern decomposition Method" (PDM) [Fujiwara et. Al. 1996]. The PDM is a kind of spectral mixing analysis but the spectrum of each pixel is expressed as the linear sum of three universal spectral patterns, namely the spectral patterns of three representative land objects, water, vegetation and soil. The usage of universal spectral patterns make possible the comparison of data of different time and also of different sensor with the same criteria.
According to the application of the PDM to LANDSAT/Tm data and simulated ADEOS-II/GLI data, it can be said that reflect light from most land cover objects can be approximated with a linear combination of the three universal patterns of water, vegetation and soil with good accuracy [Hayashi et. al. 1998]. In a sense, the universal patterns in the PDM are one kind of three principal axes in n-dimensional space but have universal physical meaning.
In this paper, the applicability of the PDM to nearly continuous spectrum data are presented. For this study, we used radio-spectrometer data measured in the field.
2. The Pattern decomposition method
In the PDm, the data for each pixel is a set of reflectance data converted from a set of brightness data of n-bands. The set of reflectance of each pixel is approximated as follows:
Ai®Cw Piw + Cv Piv + Cs Pis, (1)
Where Ai is the reflectance of band i,Piw, Piv, Pis are water, vegetation and soil universal standard spectral pattern and is normalized as Si=1n|Pik|=1 (k=w,v,s) and Cw,Cv,Cs are three pattern decomposition coefficients with the condition of Cw>0, Cv>0, and Cs>0. the three pattern decomposition coefficients Cw, Cv, and Cs are evaluated using the least squares method.
Using the remainder of I band's reflectance,
Ri=Ai-(CwPiw+CvPiv+CsPis). (2)
and the squared sum of the reminders, X= Si=1n Ri2, the relative error of all bands is defined as follows:
E=(X)1/2/ Si=1n Ai (3)
The error index of reduced -c2 is also defined as follows:
cn-32 = X/ degree of freedom = Ri2/(n-3) (4)
The denominator (n-3) is the degree of freedom for a data set of n-bands.
To study information transfer from original data by the PDM, the information defined by Shannon in bit unit
I=-cpilog2(pi) , (5)
was used, where pi is a probability of event i. for satellite data, pk (x) is probability of frequency distribution of reflectance x for band k.
3. Data used in this analysis
The data for this analysis was measured with the ratio-spectrometer of Field Spec FR (Analytical Spectral Devices Inc.) or MSR7000 ( Opto Research Corp.). Both radio-spectrometers gives reflectance values every 1 nm with a spectral resolution of 3nm. In this analysis, we averaged every 10 data points to simulate 10 nm resolution data. The spectral region used for this analysis was restricted to where the atmospheric transmittance is higher than 80%. In all, 121 bands with 10 nm width were selected as shown in Figure 1. the number of samples for this analysis was 595.
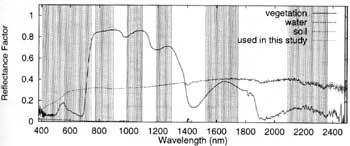
Figure 1 Selected 121 band indicated by vertical lines and three un-normalized universal reflectance patterns of vegetation, water and soil.
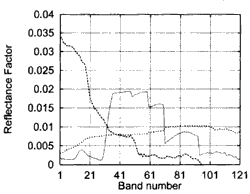
Figure 2 three normalized universal patterns of vegetation, water and soil for 121 band.
Figure 2, shows the normalized universal spectrum patterns of water, vegetation and soil, respectively. The samples for the universal spectrum patterns are the sea at Kata port, Wakayama in Japan, ten overlapped green leaves of Quecus glauca and dry desert sand near Dunhaung in China, respectively.
4.Results and Discussions
The results of the pattern Decomposition Method for some typical samples with [2] channels are shown in Figure 3. All samples have small remainders. The average relative errors defined by equation (3) for all samples is about 1.3%. The c2 defined by equation (4) is 0.002. The square root of 0.002 is 0.045 (4.5%) and is the fitting error per degree of freedom. The continuous spectral response patterns could be decomposed using only three universal patterns with 4.5% error per degree of freedom.
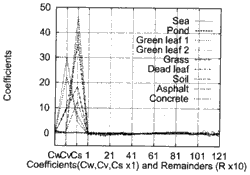
Figure 3 Pattern decomposition coefficients and remainder for typical samples
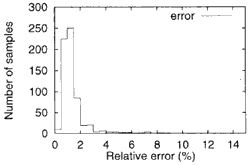
Figure 4 Frequency distribution of relatives errors.
Next, we studied the relationship between the band number and the c2. For this study, several data sets with different numbers of bands were selected from the data with 121 bands. We picked up one band from every 2 bands and made two data sets from the data with 121 bands. 75 data sets were prepared in total. We also have made a simulated TM data set that has 6 bands.
Figure 4 shows the correction between the cn-32 and the band number n. The cn-32 is decreased according to increase the band number n and converges to constant value of 0.002 for n larger than 15. The square root of 0.002 is 0.045 (45%) and is the finding error per degree of freedom. Therefore, in the PDM, the spectral reflectance can be fitted within the error of 4.5% at all measured points using only the three universal patterns. It is concluded as a general rule that land cover objects could be decomposed by three universal spectral patterns.
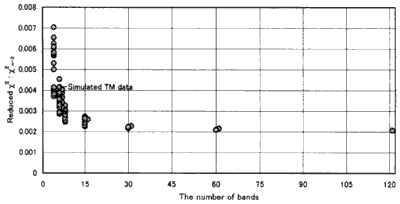
Figure 5 Reduced as a functions of the number of bands.
We applied the principle component transformation method using a correlation matrix to our 595 samples. The results are shown in the table for first 5 principal axes. The cumulative contribution rate for first three principle axes is 94.9%.
Most information is contained in the three-dimensional subspace constructed by the three principal axes. The projected lengths of three universal until vectors into this subspace are 0.938, o.994 and 0.993 for water, vegetation and soil, respectively. Therefore we can conclude that the three-dimensional subspace constructed with three universal patterns is close to the three-dimensional subspace constructed with the first three principal axes obtained from the principal component transformation method.
Using the equation (5), the information included in the original reflectance data and the three PDM coefficients are evaluated. As a result, 95.5% of the information in original data can be transformed into three decomposition coefficients.
| The number of axis | Principal value | Cumulative rate |
| 1 2 3 4 5 |
77.97 24.77 12.05 2.05 1.32 |
0.6444 0.8491 0.9486 0.9656 0.9765 |
5. Summary
We studied the applicability of the Pattern decomposition Method to a set of nearly continuous spectral reflectance data in the range of the wavelengths from 350 nm to 2,500 nm. 121 bands were selected where the atmospheric absorption was less than 20%. For all 595 samples measured in the field, nearly continuous spectral response patterns could be decomposed using only three universal spectral patterns with about 4.5% error per degree of freedom. By the PDM, the transformed information from the original spectrum data to three decomposition coefficients are about 95%.
It is understood as a general rule that land cover objects could be decomposed by three universal spectral patterns of ground objects, namely water, vegetation and soil. Using these nearly continuous universal spectral patterns, the PDM is applicable to any optical sensors with more than several band in the same framework. We have opened the three universal patterns to the public on the World Wide Web.
Acknowledgements
This work was supported under the ADOES-II/GLI project by the National Space Development Of Japan (NASDA).
References
- [Gonzalez 1977] Gonzalez, R.C., and Wintz, P., 1977, Digital Image Processing (Addison-wesley, Mass.).
- [Merembeck and Turner 1980] Merembeck, B. F. , and Turner, B.J., 1980, Directed Canonical Analysis and the Performance of Classifiers under its Associated Linear Transformation.
- IEEE Trans. Geoscience's and Remote Sensing, GE-18, 190-196. [Adams et. al. 1995] Adams, J.B. et. al., 1995, Classification of Multispectral Images Based on Fractions of Endmembers: Application to Land-Cover Change in the Brazilian Amanzon, Remote Sens. Environ., 52, 137-154.
- [Fujiwara et.al. 1996] Fujiwara, N., Muramatsu, K., Awa, S., Hazumi, T., and Ochiai, F., 1996, Pattern Expand Method for Satellite Data Analysis.(in Japanese) Journal of the Remote sensing Society of Japan, Vol. 17, No.3 , 17-34.
- [Hayashi et. al. 1998] Hayashi, A., Muramatsh, K., Furumi, S., Shiono, Y., Fujiwara, N. and Daugo M., 1998. An algorithm and a New Vegetation Index for ADEOS-II/GLI Data Analysis. Journal of the Remote Sensing Society of Japan, Vol.18, No.2, 28-50.