| GISdevelopment.net ---> AARS ---> ACRS 1999 ---> Hyper Spectral Image Processing |
Feature Extraction for Hyper
Spectral Image
Pai-Hui Hsu, Yi-Hsing
Tseng
Department of Surveying Engineering, National Cheng-Kung University
No.1 University Road, Tainan, Taiwan
Tel:+886-6-2370876 Fax: +886-6-23757464
E-mail: p6885101@sparcl.cc.ncku.edu.tw.
China Taipei
Keywords: Hyper spectral Data , feature
Extraction, Principal Component Transform, Fourier Transform, Wavelet
Decomposition. Department of Surveying Engineering, National Cheng-Kung University
No.1 University Road, Tainan, Taiwan
Tel:+886-6-2370876 Fax: +886-6-23757464
E-mail: p6885101@sparcl.cc.ncku.edu.tw.
China Taipei
Abstract:
Recently due to the advance of image scanning technology , hyper spectral image scanners which have tens or even hundreds spectral bands have been invented. Comparing to the traditional multispectral images, hyper spectral images include richer and finer spectral information than the images we can obtain, before. Theoretically, using hyper spectral images should increase our abilities in classifying land use/cover types. However, when traditional classification technologies are applied to process hyper spectral images, people are usually disappointed at the consequences of low efficiency, needing a large amount of training data, and hard improvement of classification accuracy. In order to solve this problem, our attention in the paper is focused on dimensionality reduction by feature selection or extraction. In this paper, we propose two new methods for feature extraction and compare with other feature extraction methods which have been developed from some other proposed papers. Finally, a practical AVIRIS data are analyzed to illustrate our discovery and test to show the efficiency of the new feature extraction methods.
1. Introduction
Multispectral sensors have been widely used to observe Earth surface since the 1960's. however, traditional sensors can only collect spectral data less than 20 bands due to the inadequate sensor technology. In recent years, spectral image sensors have been improved to collect spectral data in several hundreds bands, which are called hyper spectral image scanners. For example, the AVRIS scanners developed by JPL of NASA provide 224 contiguous spectral channels. Theoretically, using hyper spectral images should increase our abilities in classifying land use/cover types. However, the data classification approach that has been successfully applied to multispectral data in the past is not as effective for hyper spectral data as well.
As the dimensionality of the feature space increase subject to the number of bands, the number of training samples needed for image classification has to increase too. If training samples are insufficient for the need, which is quite common for the case of using hyper spectral data, parameters estimation becomes inaccurate. The classification accuracy first grows and then declines as the number of spectral bands increases, which is often referred to as the Hughes phenomenon (Hughes, 1968), see Figure 1.
Figure 1 Mean Recognition Accuracy vs. Measurement Complexity for the finite training case (Hughes phenomenon)
Generally speaking, classification performance depends on four factors: class separability, the training sample size, dimensionality, and classifier type (Hsien, 1998). To improve classification performance, our attention in the paper is focused on dimensionality reduction. Dimensionality reduction can be achieved in two different ways (Young and Fu, 1986). The first approach is to select a small subset of features which could contribute to class separability or classification criteria. This dimensionality reduction process is referred to as feature selection or band selection. The other approach is to use all the data from original feature space and map the effective features and useful information to a lower-dimensional subspace. This method is referred to as feature extraction. The goal of employing feature extraction is to remove the redundant information substantially without sacrificing significant information.
In this paper, we introduce a new concept of feature extraction which would transfer the spectral data from the original-feature space to a frequency-feature space. The frequency characteristics provide some useful information about the oscillation of the spectral curve for each pixel. Different type of materials can be distinguished on the basis of the differences in frequency variation. The methods we used in this study are called Fourier. Feature Extraction (FFE) and Wavelet Feature Extraction (WFE). FEE uses the global frequency characteristics of the spectral data and WFE are expected to be more meaningful and more stable than that formed by principle component transformation (PCT), which is commonly used in feature extraction.
This paper first review some feature extraction method which have been developed to speed up the process and increase the precision of classification. After, that the FEE and WFE methods are described. Finally, a 220-band AVIRIS data are analyzed to illustrate our discovery and test to show the efficiency of the new feature extraction methods.
2. Feature Selection
In feature selection, features that do not contribute to the discrimination of classes can be removed by assessing some criteria. Feature selection can not be preformed indiscriminately. Methods must be devised that allow the relative worth of features to be assessed in a quantitative and rigorous way. A procedure commonly used is to determine the separability of different classes (Richards, 1986). Separability is a measure of probabilistic distance or within classes. The separability commonly used in feature selection is Mahalanobis, Divergence, Transformed Divergence, Bhattacharya, or Jeffries-Matusita, etc (Schowengerdt, 1997).
A separability analysis can be performed on the training data to estimate the expected error in the classification for various feature combinations (Swain and Davis, 1978). Suppose the number of spectral bands is n, the problem of feature selection is to select the optimal subset of m with m<n. The number of feature combinations that need to be considered equals n!/(n-m)!m!. this number is too large for hyper spectral data and leads low efficiency in computation. Some algorithms such as Branch-and-Bound algorithm, Sequential Backward and max-Min Feature selection which can determine the optimal or suboptimal feature set were proposed to be computational feasible (Young and Fu, 1986).
3 Feature Extraction
The goal of employing feature extraction is to reduce the number of features substantially without sacrificing significant information, i.e. feature extraction is a processing of projecting the data from original feature space to a lower-dimensional subspace having more effective and frequency feature space.
3.1 Feature Extraction Based On Spectral Feature Space
3.1.1 Principal Components Transform: In Principle Components Transformation, an orthogonal subspace projection is performed on the hyper spectral images and produces a new sequence of uncorrelated images. Usually the first few components contain the most variances, and the later components which would be expected to show little variance could be ignored. Therefore, the essential dimensionality of the classification space will be reduced and thus the classification speed will be improved.
Although this method can effectively provide good classification accuracy when the number of dimension is reduced, it is sensitive to noise and has to be performed with the whole data set (Schowengerdt 1997). However, significant band differences may also appear only in the higher-order components.
3.1.2 Discriminant Analysis Feature Extraction: In Principle Components Transformation is based upon the global covariance matrix of the full set of image data and not suitable for the case of multiple classes. Another method for generating a transformed set of feature axes, in which class separation is optimized, is called Canonical Analysis (Richard, 1986) or Discriminant Analysis Feature Extraction (DAFE). This approach uses the ratio of a between-class covariance matrix to within-class covariance matrix as a criteria function. Thus a transformation matrix is determined to maximize the ratio, that is, the separability of classes will be maximum after transformation.
Although the Discriminant analysis performs well for most cases, there are several drawbacks for this method(Tadjudin and landgrebe, 1998). Frist ,the approach delivers features only up to the number of class minus one. Second , if the mean values or the same, the extracted feature vectors are not reliable. Furthermore, if a class has a mean vector very different from the other classes, the between-class covariance matrix will result in ineffective features.
3.1.3 Decision Boundary Feature Extraction: Lee and land grebe (1993) showed that discriminately information features and redundant information features can be extracted from the decision boundary itself. The approach is called decision boundary feature extraction(DBFE). It was shown that all the features needed for classification are normal to the effective decision boundary. A decision boundary features matrix(DBFM) was defined to the predict the intrinsic Discriminant dimension and to extract discriminately information features from the decision boundary.
In order to determine the effective decision boundary, the majority of training samples are first selected. The number of training samples required could be much more for high dimensional data. For hyper spectral images, the number of training samples is usually not enough to prevent singularity or yield a good covariance estimate. In addition, DBFE for more than two classes is suboptimal(Tajdudin and landgrebe,1998).
3.2 Feature Extraction Based On Frequency feature Space
3.2.1 Fourier Feature Extraction: In Fourier feature Extraction (FEE), the Fourier Transform is performed on the spectral data for each pixel and a series of Fourier spectrum is produced. The frequency power spectrum can localize information about global patterns of the spectral curve. The first component which has zero frequency represents the mean of the spectral curve for each pixel. The lowest nonzero frequency component is known as the "fundamental", and the highest frequency component called the third harmonic is three times the frequency of the fundamental, and so on .Like PCT, the first few components formed by FEE contain the most important information but FEE is more meaningful than PCT.
3.2.2 Wavelet Feature Extraction: the development of wavelet decomposition and discrete wavelet transform has thus far been in terms of multi resolution where the lower scale wavelet components are considered as the optimal approximation of a higher scale single or image (Mallat, 1989). This is indeed a powerful point of view and a accurate model for hyper spectral data analysis. Specially, we decompose the hyper spectral signature using a wavelet transform and the select the fewest wavelet coefficients require to achieve the dimensionality reduction. The scale of wavelet transform can be of a very fine scale to very coarse scale. This approach is then called Wavelet Feature Extraction (WFE). According to the wavelet theory and multireolution concept, the decomposed features wavelet transformation is the optimal approximation of original hyper spectral data.
4. Experimental Result and Analysis
The test data sets (see Figure 2.a) which were delivered by the Airborne Visual/Infrared Imaging Spectrometer (AVIRIS) I this paper are derived from Purdue University. The AVIRIS data is hyper spectral data which has 224 spectral bands from 400nm to 2450nm with 10nm spectral resolution. The test fields with the size of 68*85 take over an agricultural portion on NW Indiana in 1992. the ground truth data shown in Figure 2.b include Corn, Grass, Soybean-1 and Soybean-2. All the feature extraction methods mentioned above were performed on the test data to reduce the dimensionality. In feature selection, we used the Sequential Forward method with Bhattacharya distance to select the optimal feature combinations. The approach used for classification is the maximum Likelihood Classifier after feature extraction. The number of training samples used in the classification is 350 for each class. Figure 3. shows the result Because the number of features delivered by DAFE method is only up to the number of classes minus one, the classification accuracy is only calculated in two and three bands.
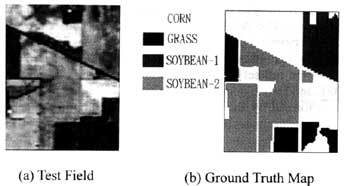
Figure 2. The test data delivered by AVIRIS on NW Indiana in 1992.
Figure 3. Classification accuracy using different feature extraction methods.
The objective of this experiment is to compare the proposed feature extraction methods with the two new methods in classification of hyper spectral data. Several results shown in Figure 3 are described in order. First, As the number of features reduced, the accuracy of classification start to reduced. Second, when the number of bands is reduced from 220 to 30, all the methods except for the DBFE and DAFE have the similar classification accuracy of 95%. It can be found that the result of DBFE is not desirable, the reason mentioned above is that the DBFE depends on the number and distribution of the training samples. Third, when the number of extracted feature is 5, the result of FFE is the best. It preserves the classification accuracy of 90%. When the number of extracted feature is 3, the classification accuracy of 90% using DAFE is the best.
4. Conclusion
The goal of employing feature extraction is to reduce the number of features substantially without sacrificing significant information. Thus the accuracy of classification could be preserved and the speed of computation could be reduced. This paper compared some methods of feature extraction which have been proposed in some articles. In addition, two new feature extraction methods are developed by Fourier transform and wavelet transform and compare with other proposed methods. The result shows that the two new methods can exactly reduce the dimensionality of hyper spectral data and preserve the accuracy of classification.
All methods mentioned in this paper are compared. The PCT is based upon the global covariance matrix of the full set of image data and not suitable for the case of multiple classes. The result of DBFE and DAFE depends on the number and distribution of training samples. The new features spaces formed by the FEE and WFE are more meaningful and more stable than other methods.
Reference
- Hughes, G.F., 1968. "On the Mean Accuracy of Statistical Pattern Recognizers." IEEE Trans. Inform. Theory IT-14. pp. 55-63.
- Hsien P.F. and D. Landgrebe, 1998. "Classification of High Dimensional Data." Ph. D. dissertation, School of Electrical and Computer Engineering, Purdue University, West Lafayette, Indiana.
- Jimenez, L.O. and D. Landgrebe, 1995. " High Dimensional Feature reduction Via Projection Pursuit" , PhD Thesis and School of Electrical & Computer Engineering Technical Report TR-ECE 96-5, Purdue University.
- Lee C. and D. Landgrebe 1993. "Feature Extraction and Classification Algorithms for High dimensional Data", TR-ENVIRONMENT 93-1, Purdue University.
- Mallat, S.G., 1989a. " A Theory for Multiresolution Signal Decomposition: The Wavelet Representation", IEEE Trans. On Pattern Analysis And Machine Intelligence, Vol. 11, No. 7, pp. 674-693.
- Richards, J.A., 1993. "Remote Sensing Digital Image Analysis: An introduction", Springer-Verlag Berlin Heidelberg, Second Edition.
- Schowengerdt R.A. 1997. " Remote Sensing" Models and Methods for Image Processing", Academic Press.
- Swain, P.H. and Shirley M.D., 1978. "Remote Sensing: the Quantitative Approach", McGRAW W-HILL.
- Tadjudin, S. and D. Landgrebe, 1998. "Classification of High Dimensional Data with Limited Training Samples", PhD Thesis and School of Electrical & Computer Engineering Technical Report TR-ECE 98-8.
- Young, T.Y. and K.S. Fu, 1986. "Handbook of Pattern Recognitions and Image Processing", College of Engineering, University of Miami,. Coral Gables, Florida.