| GISdevelopment.net ---> AARS ---> ACRS 1999 ---> Hyper Spectral Image Processing |
Extraction and Recognition of
Urban Objects by Hyperspectral Remote Sensing
Liu Jiangui, Zhang Bing,
Zheng Lanfen, Tong Qingxi
Institutte of Remote Sensing Applications
Chinese Academy of Sciences,
Beijing 100101
Institutte of Remote Sensing Applications
Chinese Academy of Sciences,
Beijing 100101
Abstract
Although Hyperspectral technique was successful in natural environment and resources, it was used less in urban-related studies. This study assesses the feasibility of Hyperspectral technique in urban remote sensing. Data was acquired by the Pushbroom Hyperspectral technique Imager (PHI) at Shahe county, north of Beijing, China in June 1997. Because of the spectral complexity of urban and man-made objects, we proffer a method of classification, hierarchical and mask technique to classify the different urban objects. The method was based on relative comparison of spectral features between class pairs. The study shows that Hyperspectral data can represent the minor differences of urban objects, and can be used for the step by step classification of vegetation, water body, coal area, road and buildings with different classification of vegetation, water body, coal area, road and buildings with different roof materials in urban area.
1. Introduction
In the VIS-NIR region, urban objects have sihgnificatn spectral fingerprints, this enables spectral recognition and extraction of different terrestrial and classes (Ben-Dor 1999, Liu 1999). Due to the influence of human beings, the spectral characters are very complex, therefore, it is difficult to classify the land cover types by traditional classification techniques. The disadvantages of traditional on e layer classification techniques lies in that, only one set of possible features can be selected, and pixels of each class need to be compared with all other classes before it can be identified as a definite class. Moreover, the features used by the classification methods are selected according to the mean distance between all class pairs, this do not guarantee the optimal discrimination and recognition of each class.
In pattern recognition, classification by comparison between twp classes is the simplest problem. It provides optimal classification environment for the class pair. Land cover types have intrinsic hierarchical structure which were used by the decision tree classifiers. Primary problems considered by decision tree classifiers are to be define the classes which need to be discriminated by each node, how to control class overlaps and how to decide the number of tree layers (Safacia, 1990). This method can be used in multi-spectral and Hyperspectral image classification, where the rank of classes are defined by their spectral behavior.
Jia (1998) proffered a progressive binary decision tree classifier. The advantage of this method is that the tree structure is simple which makes the software development more general. It considers only one class pair at each node in a layer. This enables the appropriate features to be selected according to the particular pair as well as decrease the dimension of the data. This is important for Hyperspectral data analysis. The defect is that only at the last layer can all the classes be discriminated; non is classified at the middle layers. For M class problem it needs M-1 layers and M(M-1) nodes. The tree structure may grow very large if the class number is big.
In reality, some classes, such as vegetation, has spectral character that is very different from others, so it is possible to separate them by only one node in a layer. Some classes have similar character that can be treated as a general class, and can be discriminated by a node from others. Therefore, we conceive a strategy, hierarchical and masking method, to classify the different spectral classes of urban man-made objects. Compared with the method of Jia, the number of nodes and layers decrease obviously while the advantages of decision tree classifier can be preserved.
2. Data Representation
In accordance with the importance of urban survey, a studying project has been conducted in June, 1997 in Shahe, north of Beijing, China. A Chinese developed Pushbroom Hyperspectral Imager (PHI) has been used for the Hyperspectral data acquisition which was fixed on a 2-D stabilized platform in Y-5 airplane. Flight altitude was 1000 meter and GPS has been used for navigation and positioning. PHI is a CCD imaging spectrometer, which has 244 spectral bands from visible to near infrared spectral region (400-850 nm). The basic technical data of PHI are shown in table 1. in this flight , 15 channels have been selected for the data acquisition (table 2). Its pixel size is about 1.5m*1.5m. Overall 4 flight lines have been executed to cover this area.
Table 1: Technical Specification of the PHI
Table 2 Selected Channels Drom PHI in Beihai Flight
One of the four lines, which cover the most typical urban objects, was selected. The terrestrial cover types in this area were decided through image interpretation and ground survey. Land cover types in this area are consisted of vegetation, water body, roads and roofs with different materials. The overall 17 classes are listed in Table 3. in order to get rid of the influence of atmosphere and the sun spectral radiance effect, data were preprocessed by a generally used normalization method, internal average relative reflectance (IARR) calibration to convert it into relative reflectance.
Table 3. The classes found from PH1 in Beihai Flight
3. Methodology
First, we should analyze the Spectral reflectance of the classes. The relative spectra reflectance derived by IARR were plotted in figure 1 (Note that the spectrum of white roof is much higher than that of other classes, therefore its curve exceeds the selected limit of y-axis). From Fig. 1 we found that different classes have different channels that allow particular class to be separated from other classes. For examples, vegetation has unique spectral response in red and near infrared channels that can be described by the well-known index NDVI, and though water body and coal have similar spectral response, they exhibit different changing trend at channel 9 and 10. These differences in channels and changing fashion require different feature set and different classifiers to reach optimal classification.
Figure 1: Sketch map of classification at a particular node
With these considerations in mind, we proffer a strategy of classification, hierarchical and masking method, to classify the classes step by step. See Fig. 2 for the sketch of classification at a particular node. At each node of the decision tree, relative comparison was made to separate only one general class into two or several subgroups, each subgroup represents one definite class or one general class that consisted of several definite classes. A mask was made for each of the subgroup to screen it out from other subgroups. If the subgroup is a general class, it was processed at a node in the succeeding layer. One of the advantages of the strategy is that, at each node, features can be selected according to the classes that should be separated. Usually, the features can be selected the most appropriate features which allow the relative comparison. The other advantage of this strategy is that at each node, we can process the data confined by the mask by some image processing methods to emphasizes the spectral difference, and use different classifiers. This makes the advantages of the decision tree more clear and powerful. Actually if we use the same feature set and same classifier, the classifier result are the same as the single layered classification method. After all the classes have been separated, we can composite them into a unique classification map.
Figure 2: Classification flow chart
Using this method in our study site, we can extract the classes defined in Table3 step by step. Figure 3 gives the classification flow chart. At node N1, vegetation was separated first according to NDVI. NDVI was computed using channel 8 and 13. Because this feature is very strong in urban area, it induce very little error. At node N2, the remaining part can be separated into 5 subgroups according to the spectral difference from channel 5 to 8. Class 2 and 5, White roof and Grey tile roof can be separated from node N2. A parallelepiped classifier can be used (Richards, 1994). The water body in the scene are heavily polluted and appears as dark as coal. Their channel reflectance are very similar except the minor different trends at channel 9 and 10. Simple band operation such as subtract 9 from 10 can make them separable at node N3. Red and grayish red tile roofs have prominent increasing tendency from channel 5 to channel 9, and have different reflectance value between this region, so they can be separated from class 8 to 15 at node N5 and separated with each other at node N6. Subgroups that need to be further classified at node N4, N5 contains the classes with very similar Spectral response, unsupervised classifier cane be used to classify them.
Figure 3 Relative reflectance of classes
4. Result and Discussion
By using the sketch expressed in the last section, the image was classified into 17 classes. Figure 4 shows the classification result. We can see that water body and coal area is discriminated pretty well. Freeway and asphalt road, although made with same material, are spectrally different because the freeway was built later than asphalt road, the dust and maintenance conditions are different, so they can be discriminated. The partition between two strips of freeway is very completed, it is the mixture of vegetation, soil, concrete and metals which can not be classified into any class. The major land cover and metals types are cement concrete surface and oil paper roofs, with several kind of distinct roofs such as red tile roof, white roof etc. as a comparison to the traditional one layer classifiers, maximum likelihood classifier (MLC) was also used. MLC is effective to discriminate classes with prominent Spectral differences, but is not so to classify the classes with minor Spectral differences, such as water soil and coal area red tile and grayish red tile roofs. The classification accuracy was assessed using error matrix (Congalton, 1991). The accuracy of classification is great than 73% for most of the classes.
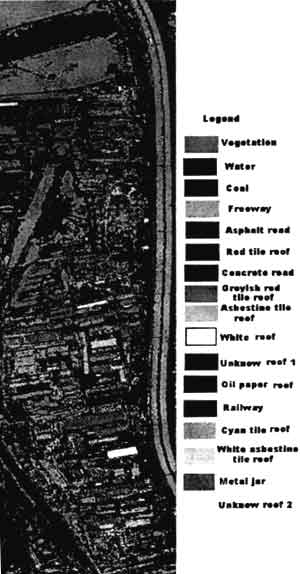
Figure 4 Classification result
It must be accounted for that the data were analyzed only based on relative reflectance. If the data id radiatively corrected and convert into reflectance, we can use the spectral library to recognize the different cover types by spectral analysis. This is feasible because hyperspectrla data have detailed spectral information about the materials.
5. Conclusion
Cover types recognition and classification is essential in remote sensing application. In the urban studies by remote sensing, high accuracy classification of cover types is a elementary step for further studies. Hyperspectral data contains fire spectral information of ground objects, this enables the spectral recognition of urban land cover types. Spectral recognition of urban land cover types. Hierarchical and masking technique is an effective tool that can classify the complex urban objects by spectral analysis. The major advantages of the method lie in that, it allow classification procedure goes from easier to difficult, and for the particular class pair different exist method of feature extraction and enhancement can be adopted.
6. References
Although Hyperspectral technique was successful in natural environment and resources, it was used less in urban-related studies. This study assesses the feasibility of Hyperspectral technique in urban remote sensing. Data was acquired by the Pushbroom Hyperspectral technique Imager (PHI) at Shahe county, north of Beijing, China in June 1997. Because of the spectral complexity of urban and man-made objects, we proffer a method of classification, hierarchical and mask technique to classify the different urban objects. The method was based on relative comparison of spectral features between class pairs. The study shows that Hyperspectral data can represent the minor differences of urban objects, and can be used for the step by step classification of vegetation, water body, coal area, road and buildings with different classification of vegetation, water body, coal area, road and buildings with different roof materials in urban area.
1. Introduction
In the VIS-NIR region, urban objects have sihgnificatn spectral fingerprints, this enables spectral recognition and extraction of different terrestrial and classes (Ben-Dor 1999, Liu 1999). Due to the influence of human beings, the spectral characters are very complex, therefore, it is difficult to classify the land cover types by traditional classification techniques. The disadvantages of traditional on e layer classification techniques lies in that, only one set of possible features can be selected, and pixels of each class need to be compared with all other classes before it can be identified as a definite class. Moreover, the features used by the classification methods are selected according to the mean distance between all class pairs, this do not guarantee the optimal discrimination and recognition of each class.
In pattern recognition, classification by comparison between twp classes is the simplest problem. It provides optimal classification environment for the class pair. Land cover types have intrinsic hierarchical structure which were used by the decision tree classifiers. Primary problems considered by decision tree classifiers are to be define the classes which need to be discriminated by each node, how to control class overlaps and how to decide the number of tree layers (Safacia, 1990). This method can be used in multi-spectral and Hyperspectral image classification, where the rank of classes are defined by their spectral behavior.
Jia (1998) proffered a progressive binary decision tree classifier. The advantage of this method is that the tree structure is simple which makes the software development more general. It considers only one class pair at each node in a layer. This enables the appropriate features to be selected according to the particular pair as well as decrease the dimension of the data. This is important for Hyperspectral data analysis. The defect is that only at the last layer can all the classes be discriminated; non is classified at the middle layers. For M class problem it needs M-1 layers and M(M-1) nodes. The tree structure may grow very large if the class number is big.
In reality, some classes, such as vegetation, has spectral character that is very different from others, so it is possible to separate them by only one node in a layer. Some classes have similar character that can be treated as a general class, and can be discriminated by a node from others. Therefore, we conceive a strategy, hierarchical and masking method, to classify the different spectral classes of urban man-made objects. Compared with the method of Jia, the number of nodes and layers decrease obviously while the advantages of decision tree classifier can be preserved.
2. Data Representation
In accordance with the importance of urban survey, a studying project has been conducted in June, 1997 in Shahe, north of Beijing, China. A Chinese developed Pushbroom Hyperspectral Imager (PHI) has been used for the Hyperspectral data acquisition which was fixed on a 2-D stabilized platform in Y-5 airplane. Flight altitude was 1000 meter and GPS has been used for navigation and positioning. PHI is a CCD imaging spectrometer, which has 244 spectral bands from visible to near infrared spectral region (400-850 nm). The basic technical data of PHI are shown in table 1. in this flight , 15 channels have been selected for the data acquisition (table 2). Its pixel size is about 1.5m*1.5m. Overall 4 flight lines have been executed to cover this area.
| Spectral Range (m) | 0.40~0.85 |
| Number of Bands | 244 |
| Spectral Sampling | 1.8nm |
| Spectral Resolution | <5nm |
| Field of View | 210 |
| Spatial Sampling | 376 pixel/line |
| Spatial Resolution | 1.5mrad |
| Digitization | 12bit |
| Data Rate | 7.2 M sample/Sec |
| Frame Rate | 60Fr/Sec (Maximum) |
| Band no. | 1 | 2 | 3 | 4 | 5 | 6 | 7 | 8 |
| Wavelength (nm) | 456 | 501.5 | 531.8 | 577.2 | 607.5 | 637.9 | 668.2 | 683.3 |
| Band no. | 9 | 10 | 11 | 12 | 13 | 14 | 15 | |
| Wavelength (nm) | 698.5 | 713.6 | 728.8 | 744 | 759.1 | 804.6 | 850 |
One of the four lines, which cover the most typical urban objects, was selected. The terrestrial cover types in this area were decided through image interpretation and ground survey. Land cover types in this area are consisted of vegetation, water body, roads and roofs with different materials. The overall 17 classes are listed in Table 3. in order to get rid of the influence of atmosphere and the sun spectral radiance effect, data were preprocessed by a generally used normalization method, internal average relative reflectance (IARR) calibration to convert it into relative reflectance.
| 1 Vegetation | 2 While roof |
| 3 Water body | 4 Coat |
| 5 Grey tile roof | 6 Concrete roof |
| 7 Asbestine tile roof | 8 Asphalt road |
| 9 High way | 10 Oil paper roof |
| 11 Railway | 12 Unknow roof1 |
| 13 Unknow roof2 | 14 Cyan tile roof |
| 15 Metal jar | 16 Red tile roof |
| 17 Greylish red tile roof | |
3. Methodology
First, we should analyze the Spectral reflectance of the classes. The relative spectra reflectance derived by IARR were plotted in figure 1 (Note that the spectrum of white roof is much higher than that of other classes, therefore its curve exceeds the selected limit of y-axis). From Fig. 1 we found that different classes have different channels that allow particular class to be separated from other classes. For examples, vegetation has unique spectral response in red and near infrared channels that can be described by the well-known index NDVI, and though water body and coal have similar spectral response, they exhibit different changing trend at channel 9 and 10. These differences in channels and changing fashion require different feature set and different classifiers to reach optimal classification.
Figure 1: Sketch map of classification at a particular node
With these considerations in mind, we proffer a strategy of classification, hierarchical and masking method, to classify the classes step by step. See Fig. 2 for the sketch of classification at a particular node. At each node of the decision tree, relative comparison was made to separate only one general class into two or several subgroups, each subgroup represents one definite class or one general class that consisted of several definite classes. A mask was made for each of the subgroup to screen it out from other subgroups. If the subgroup is a general class, it was processed at a node in the succeeding layer. One of the advantages of the strategy is that, at each node, features can be selected according to the classes that should be separated. Usually, the features can be selected the most appropriate features which allow the relative comparison. The other advantage of this strategy is that at each node, we can process the data confined by the mask by some image processing methods to emphasizes the spectral difference, and use different classifiers. This makes the advantages of the decision tree more clear and powerful. Actually if we use the same feature set and same classifier, the classifier result are the same as the single layered classification method. After all the classes have been separated, we can composite them into a unique classification map.
Figure 2: Classification flow chart
Using this method in our study site, we can extract the classes defined in Table3 step by step. Figure 3 gives the classification flow chart. At node N1, vegetation was separated first according to NDVI. NDVI was computed using channel 8 and 13. Because this feature is very strong in urban area, it induce very little error. At node N2, the remaining part can be separated into 5 subgroups according to the spectral difference from channel 5 to 8. Class 2 and 5, White roof and Grey tile roof can be separated from node N2. A parallelepiped classifier can be used (Richards, 1994). The water body in the scene are heavily polluted and appears as dark as coal. Their channel reflectance are very similar except the minor different trends at channel 9 and 10. Simple band operation such as subtract 9 from 10 can make them separable at node N3. Red and grayish red tile roofs have prominent increasing tendency from channel 5 to channel 9, and have different reflectance value between this region, so they can be separated from class 8 to 15 at node N5 and separated with each other at node N6. Subgroups that need to be further classified at node N4, N5 contains the classes with very similar Spectral response, unsupervised classifier cane be used to classify them.
Figure 3 Relative reflectance of classes
4. Result and Discussion
By using the sketch expressed in the last section, the image was classified into 17 classes. Figure 4 shows the classification result. We can see that water body and coal area is discriminated pretty well. Freeway and asphalt road, although made with same material, are spectrally different because the freeway was built later than asphalt road, the dust and maintenance conditions are different, so they can be discriminated. The partition between two strips of freeway is very completed, it is the mixture of vegetation, soil, concrete and metals which can not be classified into any class. The major land cover and metals types are cement concrete surface and oil paper roofs, with several kind of distinct roofs such as red tile roof, white roof etc. as a comparison to the traditional one layer classifiers, maximum likelihood classifier (MLC) was also used. MLC is effective to discriminate classes with prominent Spectral differences, but is not so to classify the classes with minor Spectral differences, such as water soil and coal area red tile and grayish red tile roofs. The classification accuracy was assessed using error matrix (Congalton, 1991). The accuracy of classification is great than 73% for most of the classes.
Figure 4 Classification result
It must be accounted for that the data were analyzed only based on relative reflectance. If the data id radiatively corrected and convert into reflectance, we can use the spectral library to recognize the different cover types by spectral analysis. This is feasible because hyperspectrla data have detailed spectral information about the materials.
5. Conclusion
Cover types recognition and classification is essential in remote sensing application. In the urban studies by remote sensing, high accuracy classification of cover types is a elementary step for further studies. Hyperspectral data contains fire spectral information of ground objects, this enables the spectral recognition of urban land cover types. Spectral recognition of urban land cover types. Hierarchical and masking technique is an effective tool that can classify the complex urban objects by spectral analysis. The major advantages of the method lie in that, it allow classification procedure goes from easier to difficult, and for the particular class pair different exist method of feature extraction and enhancement can be adopted.
6. References
- E. Ben-dor, N. Levin, H. Saaroni, 1999, Remote Sensing of an Urban environment Using Hyperspectral Technology, Proceedings of the Thirteenth International Conference on Applied Geological Remote Sensing. 1-3 March 1999, Vancouver, BC. Canada, 116-11.
- Congalton, Result G., 1991, A review of Assessing the Accuracy of Classification of Remotely Sensing Data. Remote Sensing of Environment, 37:35-46(1991).
- Xiuping Jia and J. A. Rechards, 1998, Progressive Two-class Decision Classifier for Optimization of Class Discriminations. Remote Sensing of Environment, 63:289-297 (1998).
- Liu Jiangui, Recognition and Extraction of Urban and Man-Made Objects Using Hyperspectral Data: Unpublished Ph. D. Dissertation. Institution of Remote Sensing Application. CAS,S.R. China , 1999.
- J.A. Richards , 1994, Remote Sensing Digital Image Analysis, Springer-Verlag, Berlin, p.340.
- S.R. Safavian, D.A. Landgrebe, 1990, A Survey of decision tree classifier methodology. IEEE Trans. On system, Man, and Cybernetics, Vol. 21. 660-674 (1990).