| GISdevelopment.net ---> AARS ---> ACRS 1999 ---> GIS |
Multi-Criteria Evaluation of
Land use Effects on Environment using Quantitative Methods in GIS: The
Talighan Basin (Iran)
Dr. Farshad Nourian and Mr.
Ali Jahani (Iran)
Department of Urban and Regional Planning, Faculty of Fine Arts
University of Tehran, Tehran, Iran
Tel:+91-21-6409696 Fax: +91-21-6461504
E-mail: fnoorian@chamran.ut.ac.ir
AbstractDepartment of Urban and Regional Planning, Faculty of Fine Arts
University of Tehran, Tehran, Iran
Tel:+91-21-6409696 Fax: +91-21-6461504
E-mail: fnoorian@chamran.ut.ac.ir
Rapid land use change has become a recurring phenomenon in the developing world, leading to a built up of pressure on environment. The objective of this study is to determine the effectiveness of the Minimum Distance to Ideal Point (MDIP) method when evaluating the land use effects on environment The results obtained from the MDIP is compared with the results from the more common overlay method, using the image processing of Landsat Thematic Mapper (TM) data and geographic information systems (GIS). It is shown here that MDIP method is more effective in reducing cost and facilitating the evaluation process since it takes advantage of and can be utilized with ease in a GIS environment.
Introduction
Rapid land use change has become a recurring phenomenon in the developing world. One reason is said to be the accelerated rate of urbanization in those nations; a rate much faster than in the developed ones (Pugh, 1996). Following a similar pattern in Iran, the growth of urban population and economy has created a higher urban land demand than previous decades, leading to significant change of landscape. The result has been a built up of pressure on environment. As urban regions grow, more land will be needed to satisfy further growth of urban population in the future (Yeh, and Li, 1998).
Thus, it is becoming increasingly important to effectively analyze ecological, economic, social and human resources in order to properly define the use for each piece of land (Tri, 1993). It is expected that the results of such studies lead to development of appropriate planning and policy making alternatives for affected regions before it is too late. (Pereira and Stein, 1993; Chafer and Wright, 1994).
In examination of any region's ecological characteristics, it is apparent that major factors which can define suitable land for particular use, are not equal in terms of significance. In fact, some factors are more important than others, and therefore, appropriate weights for each factor need to be considered (Makhdoum, 1993). There are a number of methods to help the researcher to decide on weights. (Bronsveld et al., 1994; Tri, 1993, p.377). Most ,methods, however, are based on qualitative decision-making and personal judgment. In effect, in such methods, the importance of each factor is considered in isolation and the interaction between factors is mainly ignored.
One such method, which has been traditionally used in evaluation of land use effects, is referred to as "overlaying"(Carver 1991; Pereira and Stein, 1993, p.420). In this article, the results obtained from the said method is compared with results of another using image processing of Landsat Thematic Mapper (TM) data and geographic information systems (GIS).
In the outset it needs to be mentioned that there are several methods which are more compatible with digitized data and raster GIS, including the "logical combination", "concordance-discordance analysis", "weighted linear combination" and "minimum distance to ideal point" (MDIP). It is only the latter, however, which is discussed in more detailed here. The objective of this study is to determine the effectiveness of the MDIP method as compared with the traditional one when evaluating the land use effects on environment. Here, the possibilities of analyzing land suitability using remote sensing data with GIS is explored.
Changing Character of the Study Region
The study area is located in the northern part of Iran, referred to as Talighan (figure 1). This region, which is now an agricultural spans, dissected by many creeks with villages scattered over the landscape, is bound to witness a great and rapid change soon. It is a combination of region's old and newly created attributes which is making her attractive to Iranians either as tourists or as prospective long-range settlers.
Figure 1: Proximity of Talighan to city of Tehran
First, the region is blessed with a natural beauty of its own: 240 square kilometers of mountain peaks and valleys surrounded by the snowy Alborz mountains and Alamut, Zyaran, Justan and Nesa watersheds sitting between 36 5' to 36 19'N and 50 36'E to 50 54'E. Second, a major dam over the Talighan River was recently completed and officially inaugurated. Besides the dam's utility for irrigation and electricity production, it is fast becoming an attractive site for fishing, boating and water-skiing enthusiasts.
Third, Talighan is only a 60 minute drive from Iran's populous capital, Tehran. Considering its proximity to the Talighan region, many of Tehran's residents fatigued by work and pollution, not only would plan to spend their weekends there, but may even make long range commitments to settle in the region and commute to the capital. All together this is leading to higher land prices in the region which in turn encourages the natives to eventually sell their lands to either speculators or the new settlers. As for now, it is neither politically nor economically prudent for the government to intervene in the market and forbid transactions. Therefore, one can expect an alarming pressure being built up on the environment, leading to haphazard development of land use and a long-term destruction of the region with national significance. To intervene in this destruction process, a method is first needed to seek suitable land for various expected or planned uses. In the following sections, a quantitative method used in the GIS environment is discussed for evaluation of the expected land use effects in the Talighan region.
A Case Made for using GIS Methodology
For the region described above, it is necessary to perform a multi-faceted evaluation of resource capacities. A common method to achieve this evaluation, is the mutli-critera evaluation in which land suitability is examined based on thinking through a multiple of objectives. In this method, overlaying is often used and factors such as slope and elevation are considered but without regards to their continuos nature. Instead, data is categorized as if it were discrete data, based merely on personal judgment. Also, in the overlaying technique, assigning different weights for different variables is a difficult and inefficient task when one intends to take into account the qualitative-ness of issues i.e. whether a use is compatible with other land use or not (Carver, 1991). The users and experts alike, however, prefer the overlaying technique over others and tend to ignore its limitation mostly due to its arithmetic simplicity.
On the other hand, GIS as a powerful tool in decision support, can reduce the time and cost of evaluation process and can assist the users in selection of an appropriate strategy (Leung, 1992). Although computer and GIS application in studying the natural resources are expanding, the methods of data integration and analysis have seen a paucity in discussion.
Minimum Distance to Ideal Points
Minimum distance to ideal point (MDIP) is a common technique in pattern recognition and clustering of data when using satellite data and raster GIS. This method is effective in evaluation of both continuos and discrete variables (Duckstien and Opricovic 1980). This is based on calculating the Euclidean distance of each alternative land use to the ideal point. The process includes pinpointing of ideal points, developing alternative metrics, standardizing data, determining relative significance of each criteria, and finally, analyzing data (Pereria and Stein,1993).
Briefly said, in multi-criteria evaluation, user is faced with a set of alternative and a number of different factors. In this set, each alternative has a number of characteristics, related to land suitability factors attached to it. Through this, the scores for each alternative is determined, within which, at least one MDIP is included. The land use alternatives with higher scores are more important than others.
In such cases, resources can be allocated to not one but several land use according to longitudinal or location considerations. In such situation and specially due to high volume and complexity of data, the planners cannot reach a valid conclusion. Here, MDIP can be used to drive the alternatives. In this method, each of the suitability maps, which are produced in the multi-objective evaluation process, are placed in a vector space, along one axis. In such a space, each alternative is within the reach of the decision maker based on its level of suitability. Selection of best alternative for each land use takes place by using the decision making line. This line is the best fit on the vector space.
Methodology
In this study, ARC/info and IDRISI are used as GIS softwares. The land use map is produced by using digital data from Landsat-5 TM through hybrid classification. The greenness and wetness maps are created by using tasseled cap technique. Digital Terrain Modeling (DTM) of the Talighan region including height, aspect and slope is created through digitizing topography map of the region. The existing soil and geological maps are also digitized and are used in determining land suitability for agricultural, pasture, orchards, urban and tourism land use.
As discussed above, multi-objective evaluation in MDIP method requires determination of ideal points for each factor. The factor used in this study have different attributes (Including continuos and discrete). Here , two different methods are used to define the ideal points for each variable taking into account the fact that variables are multi-faceted. First, variables such as soil type and aspect are considered as discrete. Thus, for each land use, the frequencies for these are calculated.
By extracting information on variables to create the evaluation metrics, the matrix elements are valued from 0 to 255. This information is used in data analysis. Weights for variables are assigned through pariwise comparison and expert judgment. Here by using the weights, the land suitability map for each land use is created.
Also, for comparison purposes, the common Boolean (Overlay) method is used to find suitable land use for the region. Here again, land suitability maps are created which show the relative suitability of alternatives for each land use. Through integration of such maps, the multi-objective land use map is also produced. Also, the present land use situation of the region is mapped and based on this, the significance of each land use in the region is determined and priorities are listed. Using different weights for each land use, the multi-objective land use map is create.
Results of The Comparison
The results obtained from the MDIP is compared with the results from the more common overlay method. This comparison took place in the IDRISI environment using the Boolean algebra (AND). Through this, it can be determined how compatible (in terms of percentages) the alternatives are (Figure 2). Also, as shown in Figure 3, in this region, the land use for tourism has the highest percentage of compatibility while orchards and pasture show lowest percentages while most differences occur in agricultural, and urban land use specifically at the boundaries.
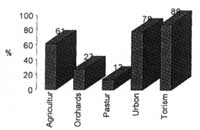 Figure 2: Compatibility of Alternatives |
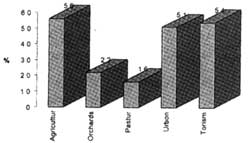 Figure 3: Differences in Compatibility at the Boundaries |
In this study, the multi-objective land use maps, which were produced by non-equal weights, were also compared with one another, using cross tabulation. The results shows that in this region, pasture and tourism are relatively in conflict with orchard and agriculture. Incompatible alternatives are shown in Table 1.
| Land use | Agriculture | Orchards | Pasture | Urban | Tourism |
| Agriculture | - | - | - | - | - |
| Orchards | 1214 | - | - | - | - |
| Pasture | - | - | - | - | - |
| Urban | 370 | 100 | - | - | - |
| Tourism | 2262 | 1488 | 4528 | 160 | - |
It is shown here that MDIP method is effective in reducing cost and facilitating the evaluation process since it takes advantage of and can be utilized with ease in a GIS environment. One reason is that suitability maps for each land use can be obtained by using only the maps related to the effective variables in each land use ; while , in the overlay method, a large number of maps and large volume of calculations are necessary because data is assumed to be discrete in nature.
Also, utilization of raster GIS in the MDIP method, considering the wide range of values for each alternative (0-255) allows for a more accurate evaluation of smaller areas with in the study region (as small as a cell dimensions size), which in turn, reduces interference of personal judgments in resource allocation to different land uses. In other words, the wide range of values in evaluation metrics allows for a more accurate statistical definition of the region's characteristics. Also by using the fuzzy logic and the Baysian Law in creating the evaluation metrics the error due to categorization variables is reduced and thus the results are closer to reality. As shown in this study, the differences between the two methods are more significant at the border areas of each land use.
Furthermore, the fuzzy logic functions used in determining the suitability of variables are flexible enough to create the evaluation metrics with more accuracy. This can speed up the calculation by the computer while avoiding repetition of algebraic calculations (due to clustering of data). Also, it is possible through metrics to quantitatively study the characteristics of variables and also to standardize the discrete data for integration with continuos data. On the other hand, the quantitative nature of data and results obtained from the common overlay method require more time and money expenditure and lead to the problem of non-equal weight consideration for different variables.
In addition, it should be noted that it is necessary for the planner to gain knowledge and understanding of the region's characteristics in order to be able to determine and include the right parameters into the model. Since the overlay method does not take into account the existing land use and conditions of the region, its results cannot be as realistic. This makes the selection of appropriate strategy for national land use planning even more difficult. On the other hand, considering the fact that nature's role in shaping the land use is significant (despite man's continuos intervention), resource evaluation and use of data frequencies as ecologic factor , as done in MDIP, can be closer to reality. In this study, the significant difference between orchard and pasture land use, when comparing the two methods, is due to the ecologic factor.
Utilization of MDIP is also effective in producing multi-objective land use map. Here, weights and tangent angle with line of best fit are used for each land use. Therefore, one can produce alternative planning policies in least amount of time and money. This method does not have the complexity of traditional method in allocation of appropriate regions for each land use and allows for easier decision making since the number of alternatives is defined by the planner. On the other hand, defining weights for land use and also the tangent angle to the line of best fit needs more care since lack of accuracy in determining the number of alternatives for each land use can lead to significant errors in decision making. Thus, it can be concluded that the MDIP method, which allows for fluid decision making, easy selection of suitable strategies, and the utilization of different weight for variables is advantageous to the traditional overlay method.
References:
- Bronsveld, K, Herman Huizing and ManuOmakupt, 1994. "Improving Land Evaluation and Land Use Planning." ITC. J, 4, pp.359-383.
- Carver, S.J., 1991. "Integrating multi-criteria evaluation with geographic information systems." Int. J. Geogr. Info. Syst., 5(3), pp. 321-339.
- Chafer, M. and Wright, G.L., 1994. " An analysis of land capability assessment using remotely sensed data.." The Australian Remote Sensing Conference Proceedings, pp. 601-608.
- Duckstein, L and S. opricovic, 1980. "Multi-objective Optimization in River Basin Development." Water Resources Research. 16, pp. 14-20.
- Eastman, J.R., 1996, "IDRISI for Windows." User's Guide. USA: Clark University.
- Leung, Y, 1992. "Towards the Development of an Intelligent Spatial Decision Support System.", In: Geographic Information Systems, Spatial Modeling and Policy Evaluation, edited by Fischer, N. and P. Nijkamp, pp.131-147.
- Makhdoum, Majid, 1993. Shaloudeh Amayesh Sarzamin Tehran (Spatial Planning of Tehran), Tehran: University of Tehran.
- Pereira, H.D. and Stein, L.D., 1993. "A multiple criteria decision making approach to GIS-based land suitability evaluation." Int J Geogr. Inf. Syst., 7(5): 407-424.
- Pugh, Cedric. 1997. "The changing Roles of Self-help in Housing and Urban Policies 1950-1960, Experience in developing Countries." TWPR, 19(1), pp.91-109.
- Tri, L.Q., 1993. "Present land use as a basis for land evaluation in the Mekong Delta." ITC J., $, pp. 377-384.
- Yeh, Anthony Gar-On and Li Xia, 1998. Sustainable Land Development Model for Rapid Growth Areas Using GIS. Geogr. Info. Sci., 12(1), pp.169-189.