| GISdevelopment.net ---> AARS ---> ACRS 1999 ---> Geology |
Estimation of The Prospective
ORE-Bearing sites using Multivariate Statistical and Image Analysis
M. Ganzorig, D.Amarsaikhan,
J.Gan-Ochir
Institute of Information and RS, Mogolian Academy of Sciences,
av. Enkhataivan-54B, Ulaanbaatar-51, Mongolia
AbstractInstitute of Information and RS, Mogolian Academy of Sciences,
av. Enkhataivan-54B, Ulaanbaatar-51, Mongolia
The aim of this study is to estimate the actual ore-bearing sites using multivariate images and statistical analyses. For this purpose, various maps and images have been used and processed for structural information extraction . the result was integrated with other cartographic and ground truth data and analyzed by a factor analysis. The determined factors are mapped and isolines for each of the calculated factors are drawn. On the basis of the factor distribution the new locations of ore-bearing sites are estimated.
Introduction
One of the most interesting geological studies is the exploration of mineral resources. A single scene of RS image or spatial data will not have efficient use for targeting of potential mines and estimation of new ore-bearing sites but will have a promising opportunity if integrated with other information such as structural information, geophysical data or ground truth information.
The prospective ore-bearing areas can be estimated using multivariate statistical analysis or GIS that contains all necessary datasets in different layers. It seems, the first method is more cost-effective while the second method fails in case of missing data but will have efficient use if the data are fully acquired and stored in a digital format [2].
The aim of this study s to elaborate a prognosis method and estimate the actual ore bearing sites using RS, GIS and multivariate statistical analyses. The study has two major parts. In the first part some information to be needed for further analysis are extracted through processing and analysis of RS and GIS datasets. In the second part, the extracted information integrated with other ground truth datasets are processed and analyzed by the use of factor analysis. The analyses were carried out using ERDAS, ILWIS system and other statistical packages.
Test Sites
As a test site the Khumul area situated in north-eastern part of Mongolia where extensive gold exploration is being carried out was selected. The geological structure in this are has its own peculiarity. In general, most of the macro structure formed in eastern part of Mongolian territory are spread towards the north-east direction. For example, the South Khentii fracture zone, the Deep Onon fracture and other large fractures situated in eastern part of athe country are located close to each other and spread towards the north-east. These geostructures were formed in different geological periods and consist of different rock types falling into the north-east direction. Therefore, they are called as fractures spread along direction of the basic structure.
However, the interpretation of the aerospace images indicates that are large deep fracture zones spread towards the north-west direction crossing the fractures falling into the north-east. Such a structure is specifically dominant in the Khumul area and is called a cross-located structure. The cross-located structure has had a significant influence on the geological development, formation of minerals and their distribution in the Khumul area [5,6].
Data Sources
- Space photographs taken form Meteor and Cosmos
- Aerial photos, scale 1:32.000
- Geological map, scale 1:200.000
- Geomorphologic map, scale 1:50.000
- Lineament map , scale 1:50.000
- Topographic maps, scale 1:50.000
- Other ground truth data.
Initially, photographs taken from " meteor " and 'Cosmos " have been converted to a digital format using a high resolution scanner. To improve the interpretation of scanned images, different spectral and spatial enhancement techniques have been applied. In this level, micro structures were not seen perfectly but the basic applied. In this level micro structures were not seen perfectly but the basic structures of the main lineaments and fracture zone were clearly seen. The lineaments were interpreted and digitized using screen digitizing module of the ERDAS system [2,3]. Comparing the interpreted map with the available lineament map, a final lineament map was created.
For the structural analysis, density map and rose-diagram have been created. The density map of lineaments indicated that the fractures re more evenly distributed in each of the defined grid cells. It each clearly seen from the built up rose diagram that athe geostructures are mainly spread within azimuths of 20-40, 270-280, 310-320 and 350.
To support further analysis, a DEM of the study area was created. Fro this purpose, the contours with 20m intervals were digitized from topographic maps of a scale of 1:50,000 and then interpolated. The lineament map overlain on top of the created DEM is shown in figure 1b. for morphological study, a shaded relief map was created using the DEM and the appropriate values fro sun elevation and azimuth were 45 and 30, respectively. Moreover, the contours and rivers were overlain on the shaded relief map [3,7] .
In this integrated map, the major morphological structure was clearly seen. Fro further analysis, a geomorpholgical map of a scale of 1:50,000 and a geological map of a scale of 1:200,000 were converted to a digital format by the use of a scanner and then georeferenced.
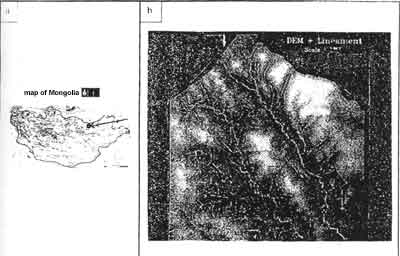
Figure 1. Location of a test site (a) and a lineament map overlain on top of the DEM.
To perform more detailed analysis, aerial photographs were converted to a digital format and the defined resolution was 300 dpi.
To improve the determination of natural objects, different types of spatial enhancement techniques such as average, Robert, Sobal and Laplacian type filters were applied to the aerial images . the result of the spatial convolution were assigned to red, green and blue colour images significantly improved the interpretation. In the colour images, specifically circle structures of regional and local levels were clearly seen. As a result of the interpretation, a structural map was created. Furthermore map was compared with geological and geomorphological maps.
To test the accuracy of the interpretation, the same image was given to two thematic interpreters with different experiences. The result of the interpretation was analysed using linear regression model. The correlation coefficient was 0.65. During the analysis it was seen that the 3D images created by integration of the DEM and the geological and geomorphological maps significantly improves the interpretation and investigation of some peculiar morphological structures [8]. A 3d view of geology of the study area is shown in figure 2.
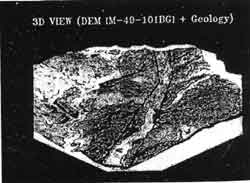
Figure 2. A 3D view of geology of the Khumul area.
Multivariate Statistical Analysis
For the investigation of the actual new ore-bearing sites, a factor analysis has been applied [1,4] and a total of 34 variables such as the length and density of the lineaments, geological structural information, gold ore, the present distribution of the gold mine and other necessary information were used. The study areas was divided into grid cells each of which was 2kmx2km and a total of 156 cells were defined. In the factor analysis R-mode approach has been used.
As a result of the analysis the following were defined .
a) factor loading was calculated and the factors containing highest values were selected.
b) The variables which are highly correlated with the observed factors were selected.
c) Anomalies were calculated and 4 factors were selected after a varimax rotation.
Here, as an additional estimation, the sum of all projections has been used. The determined factors were mapped and isolines for each of the calculated factors were drawn. The isolines were overlapped and on the basis of the delineated isolines the new ore-bearing sites were determined
Figure 3. Defined locations of gold distributions estimated by a factor analysis
Conclusions
The aim of this study was to estimate the actual ore-bearing sites in the Khumul area, north-eastern Mongolia, integrating data from multiple sources. As seen from the analysis, RS and GIS techniques have an efficient usage for data analysis and extraction of structural information and when integrated with multivariate statistical analysis can be considered as a powerful technique for the estimation of the possible new locations of minerals. Moreover, the same approach can be applied for the estimation of other land resources.
Refernces
- A.R.H.Swan, M.Sandilands, P.McCabe, 1995, Introduction to Geolgical Data Analysis, Blackwell Science Ltd, pp435.
- D.Amarsaikhan, M.Ganzorig, J.Gan-Ochir, I.Ulemj, D.Narangerel, 1997, Estimation of Mineral Resources using GIS and Statistical Methods, Scientific Report of the Institute of Informatics and R.S, Academy of Sciences, Ulaanbaatar, Mongolia.
- ERDAS, 1991, User's Guide, ESRI, USA.
- J.Davis, 1986, 2nd ed. Statistics and Data Analysis in Geology, Publisher Wiley, New York, pp646.
- J.Gan-Ochir, 1997, Relationship between Geostructure and Minerals in Khumul- Balj Area, Geological Report, Ulannbaatar, Mongolia.
- J.Gan-Ochir, Z.Ariun, Ts.Bekhtur, 1989, Geostructure, Complex Methods of Estimation of Mineral Resources of Geological Structure in Mongolian Territory, Ulaanbaatar, Mongolia.
- ILWIS, 1992, User's Guide, ITC, The Netherlands.
- M.Ganzorig, D.Amarsikhan, B.Enkhtuvshin, Kh.Tulgaa, 1994, Design of A Multilevel Databases using RS and GIS Techniques, Proceedings of ACRS, Bangalore, India.