| GISdevelopment.net ---> AARS ---> ACRS 1999 ---> Forest Resources |
Monitoring of Forest Cover
Change in Tanh Linh District, Binh Thuan Province, Vietnam By
Multi-temporal LANDSAT TM Data
Nguyen Dinh Duong, Le Kim
Thoa, Nguyen Thanh Hoan
Environmental Remote Sensing Laboratory (ERS Lab)
Institute of Geography
Hoang Quoc Viet Str., Cau Giay, Hanoi, Vietnam
Phone: 84-4-7562417, Fax: 84-4-8361192,
E-mail: duong.nd@hn.vnn.vn
Chu Thi Binh
College of Forestry
Xuan Mai, Hoa Binh, Vietnam
VIETNAM
Keyword: Forest cover, Normalized Vegetation
Index, Total Reflected Radiance Index, Remote Sensing, Change
AnalysisEnvironmental Remote Sensing Laboratory (ERS Lab)
Institute of Geography
Hoang Quoc Viet Str., Cau Giay, Hanoi, Vietnam
Phone: 84-4-7562417, Fax: 84-4-8361192,
E-mail: duong.nd@hn.vnn.vn
Chu Thi Binh
College of Forestry
Xuan Mai, Hoa Binh, Vietnam
VIETNAM
Abstract
Forest cover is an important indicator for environmental assessment of a territory. Land cover maps that also shows forest cover can be established by different methods, with different levels of accuracy. However, in environmental assessment, time and accuracy are requirements which should be fulfilled. Fast analysis provides the ability to accomplish land cover mapping of large areas in a short time. Appropriate accuracy ensures that the thematic content of the map is on an adequate level. In this paper the authors report on the application of the normalized vegetation index (NDVI) and the total reflected radiance index (TRRI) for land cover mapping with an emphasis on forest cover in the area of Tanh Linh District, Binh Thuan province, Vietnam. Recently drastic clear cutting of natural forest has occurred in this area for different purposes: logging, agricultural cultivation etc. The research has been performed based on multi-temporal LANDSAT TM data (1989, 1992, 1996 and 1998) and topographical maps compiled in 1965. Change analysis has been executed based on digital interpretation results. The authors further report on a land cover classification algorithm with NDVI and TRRI indices, which enables the removal of some inaccuracies of vegetation classification by the NDVI method in the case of high resolution data.
Introduction
Vegetation cover in general and forest cover in particular are indicators for the quality of the environment. The methods of vegetation and forest cover classification has progressed in recent years. However, speed of analysis and accuracy of results are problems under discussion and issues to be improved. In this paper the authors have developed a method of automated classification of forest cover which can be used for any remote sensing data set which has at least two spectral channels in the red and infrared regions. The proposed method has been used to asses forest cover change of an area that belongs to Dong Nai and Binh Thuan provinces The study area covers Tan Phu, Ham Tan and Tanh Linh districts where recently drastic forest clear cutting has occurred that has led to serious environment problems such as drought, flooding etc. The flush flood which occurred on July 30, 1999 is the biggest flood in over 20 years in this area and has caused very serious damage for local people. During the period from 1965 to 1998 about 52% of natural forest cover has been cut in the study area. When comparing forest cover of 1998 to 1989, 33% of natural forest cover has been cleared. Apparently if the forest cover had not been destroyed in such a scale, maybe many disasters would not have occurred as seriously as they have done recently. Moreover, when comparing the official statistical data from the National Statistical Yearbook for Vietnam with data with data derived from satellite remote sensing data one finds out very large discrepancies. According to the Statistical Yearbook from 1990 to 1995 only 11,922 ha of natural forest had been cut for the two provinces Dong Nai and Binh Thuan, but from remote sensing data the depletion of natural forest for only two districts is as much as 22,259 ha. Certainly if we use remote sensing techniques to detect forest cover change for all of the two provinces, the depleted forest area will be much greater than the official figure. Apparently the development of remote sensing techniques to monitor forest cover is urgently needed. The data derived from remote sensing image is objective and reliable for evaluation of the status of the environment and also very useful for the selection of proper environmental management schemes.
Materials and Method Materials and Method
The following information sources have been used for study:
- Topographical maps, scale 1/50,000, published in 1967
- LANDSAT TM images from 1989, 1992, 1996 and 1998
- Ground truth data in the study area from 1997, 1998 and 1999
Figure 1. Forest cover extracted from topographical maps UTM 1965
LANDSAT TM data from 1989, 1992, 1996 and 1998 of the study area enable us to monitor the change of land cover. False color composites of the years 1989 and 1998 are shown in Figure 2. By only visual comparison one could recognize a big change in forest cover between the two dates. The destroyed forest is not only evident by clear cutting but also by forest quality degradation. The latter is possible to detect by remote sensing techniques, however, it requires more complicated analysis methods.
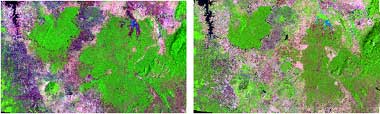
Figure 2. Forest cover of 1989 (left) and 1998 (right) based on LANDSAT TM. Color composite band 5 = red, 4 = green,
3 = blue
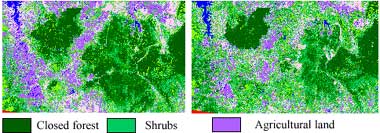
Figure 3. Forest cover classification result of 1989 (left) and 1998 (right) by LANDSAT TM
To carry out fast analysis of multitemporal TM data the authors have applied the classification method proposed in [1]. This is a simple automated classification method suitable for natural resource inventory in a large area. The classification method is fast and provides results with acceptable accuracy. This method is based on the normalized vegetation index NDVI and the total reflected radiance index TRRI. A scatter plot of NDVI and TRRI is shown on Figure 4. While the NDVI provides information about vegetation distribution in the study area, the TRRI shows levels of radiance reflectance of land cover objects. Apparently, there are many objects with the same NDVI values and by taking TRRI in to consideration they can be classified further into different classes.
The NDVI is computed by the following formula:
Where Infrared and Red are digital counts of infrared and red channels.
The TRRI index is computed by the formula:
Where
Ii ... Digital count of a pixel in channel i
n ... Number of spectral channels
Imax ... Maximum digital count
D ... Integral step
Figure 4. Scatter plot of NDVI and TRRI indices
Data Normalization and Classification
Multi-temporal data needs to be normalized before classification. There are several methods to do this but the simplest one is based on using mean values and standard deviation as shown in [2].
Suppose in time t the data set has a mean value mt and standard deviation st and at time t+1 the corresponding values are mt+1 and st+1 then values of time t normalized for time t+1 are given the following formula:
The time point 1998 has been chosen as a reference for normalization of data from another time. After normalization by the given formula the data set is ready for analysis by NDVI and TRRI indices . Thanks to data normalization threshold values defined for the data set 1998 and given in Table 1 can be applied to all other time points.
Based on the table of threshold values for NDVI and TRRI the authors have developed an algorithm for automated classification using an external table of legend. This algorithm allows classification of different data sets by the same table of legend which is defined by a pair of NDVI and TRRI values . The computation flowchart of this algorithm is shown on Figure 5.
Table 1: Threshold values of TRRI and NDVI for different land cover categories
TRRI
| 100 | 11 | 11 | 11 | 11 | 11 | 11 | 11 | 11 | 11 | 11 |
| 44 | 8 | 8 | 8 | 8 | 8 | 8 | 8 | 8 | 8 | 8 |
| 31 | 8 | 8 | 8 | 8 | 6 | 5 | 3 | 4 | 4 | 4 |
| 28 | 9 | 9 | 8 | 7 | 6 | 5 | 3 | 4 | 4 | 4 |
| 26 | 10 | 9 | 9 | 7 | 6 | 5 | 3 | 4 | 4 | 4 |
| 22 | 10 | 9 | 9 | 7 | 6 | 5 | 3 | 4 | 4 | 4 |
| 20 | 10 | 9 | 9 | 7 | 6 | 5 | 3 | 2 | 4 | 4 |
| 17 | 10 | 9 | 9 | 7 | 6 | 5 | 3 | 2 | 1 | 1 |
| 15 | 10 | 9 | 9 | 7 | 6 | 5 | 3 | 2 | 1 | 1 |
| 11 | 10 | 10 | 10 | 7 | 6 | 5 | 3 | 2 | 1 | 1 |
| 2 | 12 | 12 | 12 | 12 | 12 | 12 | 12 | 12 | 12 | 12 |
| 0 | 115 | 127 | 141 | 152 | 167 | 193 | 207 | 217 | 226 | 255 |
NDVI
| 1 – Closed forest | 7 – Land with little vegetation cover |
| 2 – Forest of medium leaf coverage | 8 – Dry agricultural land |
| 3 – Sparse forest | 9 – Wet agricultural land, |
| 4 – Forest plantation | 10 – Water |
| 5 – Orchard or shrub. | 11 – Cloud |
| 6 – Other agricultural cultivation | 12 – dummy |
Figure 5 Flowchart of classification programme
After reading the table of legend, the programme will determine how many classes are to be classified. For each pixel vector the programme computes pairs of NDVI and TRRI values and compares it with those in the table of legend. The pixel which has a pair of NDVI and TRRI values meeting the threshold range of a category in the legend will be classified to that category. With the same table of legend, the programme can classify different input images so we can talk about automated classification. Figure 5 shows a flow chart of the proposed classification scheme.
Change Analysis and Prediction
After classification of the series of image data from 1989 to 1998 we can make change analysis of land cover as well as predictions of the development trends. The natural forest will be a key point of our analysis. The forest cover of 1965 has been computed by using 1965 topographical maps. The data on forest cover of other time is derived from classification result of the TM data series. If we take the forest cover of 1965 as a reference then about 27.7% and 52% of forest cover had been cut by 1989 and 1998 respectively. The rate of forest lost varies over the time. In the period from 1965 to 1989 on average about 1516 ha of forest (4.78%) per year was cleared. During the period from 1989 to 1998 the forest cutting reached a higher rate. Annually about 3.74% forest cover was lost in this period. The analysis of forest cover change is shown in detail in Table 2. When we compare the previous result with official statistical data from the National Statistical Yearbook 1996 we discover very large discrepancy. According to the official data for the period 1989 – 1996 only 11,922 ha of natural forest has been cut in the area of provinces Dong Nai and Binh Thuan, but for the study area that spreads over only two districts the forest loss, estimated from remote sensing data, is 22,262 ha - almost two times greater than that from the Yearbook. This is a fact that reflects unreliability of the existing forest inventory mechanism which needs to be improved urgently. If the forest lost will continue as in the period 1989 – 1998 then by 2016 no natural forest will exist in the study area.
Table 2. Summary of forest cover change in the study area for the period 1965 – 1998
| Natural forest area (ha) | ||||
| 1965 | 1989 | 1992 | 1996 | 1998 |
| 131321 | 94929 | 81323 | 69786 | 63012 |
| Natural forest cover lost rate | |||||||
| 1965-1989 | 1989-1992 | 1992-1996 | 1996-1998 | ||||
| Area (ha) | Percentage | Area (ha) | Percentage | Area (ha) | Percentage | Area (ha) | Percentage |
| 1516 | 1.15% | 4535 | 4.78% | 2884 | 3.55% | 3386 | 4.85% |
Conclusion
Based on change analysis of forest cover in the study area from 1965 to 1998 by topographical maps and multitemporal remote sensing data we can make the following conclusions:
- It is necessary to carry out forest cover monitoring and to warn local government on time on their exceed change.
- There is an urgent need to develop automated classification method of land cover to formulate Remote Sensing Based Operational Forest Monitoring System (RSBOFM)
- The classification method based on a pair values of NDVI and TRRI gives acceptable results and it can be used for a data set with at least two spectral channels in red and infrared regions.
- The classification data on land cover and forest cover derived from remote sensing data should be used as a reliable complementary information source to the official annual statistical data.
The author would like to acknowledge the Fundamental Research Program of Vietnam for financial support to this research.
Reference
- Nguyen Dinh Duong. Total Reflected Radiance Index – An Index to Support Land Cover Classification. Proceeding of the 19 th Asian Conference on Remote Sensing. 16 –20 November, 1998, Manila, Philippines.
- Shunji Murai. Special Course on Advanced Remote Sensing / GIS Technologies. S-3 Land Cover Change Monitoring. Asian Institute of Technology 1994.
- The National Statistical Yearbook of Vietnam 1996. Statistics Burro Publishing House 1997