| GISdevelopment.net ---> AARS ---> ACRS 1999 ---> Forest Resources |
Estimation Model of net
primary Production by Vegetation for ADEOS-11\GLI data
Shinobu Furumi Akiko Ono,
Noboru Fujiwara
Department of Information and Computer Sciences,
Nara Women's University
Kitauoya-Nishi-Machi, Nara 630-8506, Japan
Tel: +81-742-20-3738 Fax: +81-742-20-3739
E-mail : awa@cosmos.ics.nara-wu.ac.jp
AbstractDepartment of Information and Computer Sciences,
Nara Women's University
Kitauoya-Nishi-Machi, Nara 630-8506, Japan
Tel: +81-742-20-3738 Fax: +81-742-20-3739
E-mail : awa@cosmos.ics.nara-wu.ac.jp
We have been developing the model for NNP estimation using climate data and ADEOS-11\GLI data. This model is based on the relationship between the photosynthetic quantum efficiency and the new vegetation index obtained from satellite data by the pattern decomposition method. The new vegetation index is VIPD. VIPD reflects all multi-spectral data from visible to near-infrared wavelength in contrast to NDVI which is defined as a combination of red and near-infrared data. Therefore, VIPD is effective for the analysis of GLI data which has 36 wavelengths. We applied the model to Landsat\TM data and evaluated NPP based on the model.
1.Introduction
The net primary production (NPP) is defined as the net production of organic matter by the vegetation the balance between the gross primary production by photosynthesis and the respiration of vegetation. We have been developing the model of NPP estimation for ADEOS-11\GLI data. ADEOS-11 satellite will be launched in 2000 and GLI sensor has hyper-multi-spectral bands, namely 36 bands. GLI data covers global area for each 4 days. We will make a global NPP map based on this model using GLI data.
By now, we have mainly used data by NOAA/AVHRR which observes the global area frequently to obtain the global NPP map . AVHRR data has only two wavelength bands from visible to near-infrared region, namely red and near-infrared bands. However, the vegetation state affects on reflectance's from visible to near-infrared wavelength.Therefore in order to estimate NPP, it is more effective to use all GLI bands data.
The pattern decomposition method, that we developed for multi-spectral data, trans-forms all multi-spectral data to three coefficients data. The three coefficients are linear to a land cover ration in a pixel. The characteristics is important to analyze the satellite data, in particular, with low spatial resolution.We defined a new vegetation index based on the three coefficients, which includes all information from original data. It is called the Vegetation Index based on Pattern Decomposition, namely VIPD. VIPD was demonstrated to be linear to the vegetation cover ration and the photosynthetic quantum efficiency. We can estimate the production of organic matter by photosynthesis using these relationships.
In order to validate the model, we made NPP maps for Nara basin in Japan and the rain forest in Malaysia using Landsat/TM data and compared the results with that the by other models and the ground measurement data. Furthermore, we estimated NPP for rice fields of Nara basin in Japan using Landsat/TM data. Because we can consider that the rice yield is the net primary production of rice from the plantation to the harvest, it is possible to validate the model with more precise accuracy.
2. Pattern decomposition method and new vegetation index
The pattern decomposition method was developed as the analysis method of multi-spectral data [1, 2]. The concept of the method is that the spectral pattern composed with the multi-spectral data of a certain sample is able to be described by a combination of three standard patterns, namely water, vegetation and soil patterns. In other words, the method is based on the spectral mixing analysis, but the unique characteristic of the method is to fix the standard patterns as three. As a result, the multispectral data is reduced into the three decomposition coefficients (water, vegetation and soil). In addition to that, each coefficients includes the physical parameters associated with each other land cover type. Therefore, we can utilize the method for the extraction of the signature from multi-spectral data.
In fact, we can obtain the three decomposition coefficients from multi-spectral data using the pattern decomposition methods as follows.
A1 = Pw1 X Cw + Pv1 X Cv + Ps1 X Cs + R1
……..
An = Pwn X Cw + Pvn X Cv + Psn X Cs + Rn (1)
These equations are obtained for n-bands data. Here, Ai indicates the reflectance of band No.i from 1 to n bands. Pwi, Pvi and Psi mean the standard patterns for water, vegetation and soil, respectively. We determine the three decomposition coefficients Cw, Cv and Cs so that the remainders Ri is as small possible using the least square method.
After that, we defined a new vegetation index based on the method, namely VIPD.
Here, Sv and Ss indicate the "brightness" of standard vegetation and soil covers, respectively. "Brightness" means the sum of reflectances, which are used for the method.
It was demonstrated that VIPD was linear to the vegetation cover ratio [3] and the photosynthetic quantum efficiency [4]. The relationships are indicated in Fig. 1.
Figure 1: Relationships of VIPD to the vegetation cover ratio and the photosynthetic quantum efficiency.
The relationship between VIPD and vegetation cover ratio was obtained from the spectral reflectance measurements for the mixed area with leaf and soil. As for the quantum efficiency, we introduced the relationships from two measurements. One is the relationship between the quantum efficiency and chlorophyll content of leaves [5]. The other is the relationship between VIPD from spectral reflectance measurement of leaves and chlorophyll content of leaves by ourselves. From these results, we can obtain the relationship between VIPD and quantum efficiency via chlorophyll content of leaves.
3. Estimated model of net primary production
NPP depends on global primary production (GPP) and respectively loss (Rd) as described by Eq. (3).
NPP=GPP-Rd (3)
At first, we consider GPP, which depends on the photosynthetic activity. GPP is obtained from the integration of photosynthetic quantum efficiency multiplied by incident solar energy because the photosynthetic quantum efficiency is the assimilation of CO2 per unit time, area, and incident solar energy.
We can obtain the quantum efficiency from the photosynthetic curves. The definition of the efficiency is illustrated inside Fig. 2.
Figure 2. Illustration of the photosynthetic quantum efficiency inside the photosynthetic curve
Of course, we should be take account into the vegetation cover ratio (Rv) for an observed area. As a result, we obtain the following equation.
GPP=ò(Rv X QE X Rs)dt (4)
Here, Rs is incident solar radiation. The incident solar energy should correspond to the photosynthetic active radiation (PAR).
As mentioned above, VIPD is linear to the photosynthetic quantum efficiency and the vegetation cover ratio. According to the relationships, we can rewrite the above equation as follows:
Rv X QE=0.070 X VIPD[mgCO2/m2/cal] (5)
At second, we consider respiratory loss. We used to the following empirical-derived equation for the estimation of the respiratory loss (Rd) because it depends on the air temperature (T[°C])[6].
Finally, in order to estimate NPP, we need three parameters, that is VIPD from the satellite data, solar radiation, and air temperature. VIPD reflects vegetation condition. We can take account into the environmental factors of the photosynthesis by including PAR and air temperature into the model.
4. Results and discussions
We applied the model to the area around Nara basin in Japan and rain forest in Malaysia with Landsat/TM data in order to evaluate the estimation model. Theses results were composed with other models' and ground measurement data. Furthermore, we paid attention to the paddy fields. We compared the NPP values estimated from the satellite data with rice yield data, which measured after the harvest.
4.1 Results
4.1.1 NPP maps for Nara basin in Japan and rain forest in Malaysia
There are various types of vegetation in Nara Basin of Japan. Some vegetation types change with a season immediately. So, we used the five Landsat/TM data acquired in the different season (Jun.27, Aug.30, Nov.18 in 1987, Feb.22, Apr.26 in 1988). In contrast to that, we assume that the seasonal change in rain forest area of Malaysia are very small and used only one Landsat/TM data. This data was acquired on Apr.21, 1989.
We made NPP maps based on the model using VIPD from the satellite data, PAR radiation, and air temperature data. NPP maps around Nara basin and rain forest area are shown in Fig.3 (a), (b), respectively.
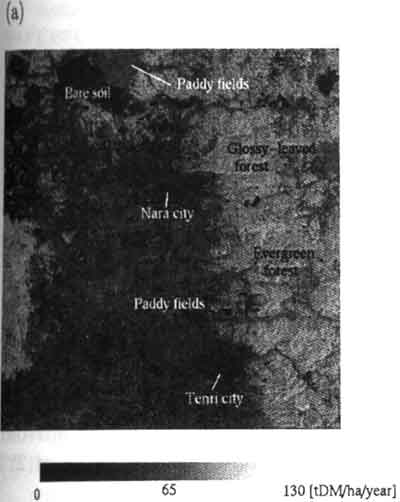
Figure 3: NPP maps around Nara basin of Japan(a) and rain forest of Malaysia (b). NPP values from 0 to 130[tDM/ha/year] are displayed as from black to white color in these figures.
From these results, NPP estimated values are about 110[tDM/ha/year], 84[tDM/ha/year], and 50[tDM/ha/year]for rain forest of Malaysia, evergreen forest of Japan, and paddy.
4.1.2 NPP estimation for paddy field
There is no difficulty in considering rice yield as NPP because the rice is harvested before its decay and the yields are the results of net production from the plantation to the harvest. So we, paid attention to the results of paddy fields so that we should be get the more precise evaluation of our model.
Rice changes greatly from plantation around June to harvest around September. Then, we used seven Landsat/TM data acquired in the different seasons through several years. VIPD changes for paddy fields are shown in Fig. 4. From these VIPD changes, we estimated NPP values for paddy fields. The estimated values [tDM/ha] are listed with the rice yields values in Table 1.
Figure 4: VIPD changes of paddy fields. X-axis indicates the accumulated date from jan.1 For example, Jun.1 and Dec.1 corresponds to 182 and 274, respectively
| Paddy area | Estimated NPP | Measured NPP |
| Wakayama area | 34.35 | 12.75 |
| Gojou area | 33.77 | 11.32 |
These values differ from the values (50[tDM/ha/year]) of the previous section because the five data that we used in the previous section was not enough to estimate NPP values for paddy fields that change with season immediately.
4.2 Discussions
We applied our model to Landsat/TM data and made NPP maps for Nara basin in Japan and rain forest area in Malaysia. According to the chikugo model based on climate data [7], NPP values around Japan are around 10-20 [tDM/ha/year], NPP measured values for glossy-leaved forest in Minamata of Japan are about 17-18[tDM/ha/year][8]. Also, for the Pasoh rain forest area in Malaysia, the NPP measured values are about 25.7 [tDM/ha/year][8].
In order to get more precise evaluation of our model, we compared the paddy yields with the NPP estimated values from our model. The results showed than the estimated values are several times bigger than the values based on the measurement.
In summary, NPP values estimated from our model tend to be bigger than the other model's estimation and ground measurement data. We suppose the tendency was mainly caused by the saturation of photosynthetic curves. We can assume the linearity of the photosynthetic curves in low solar radiation region. However, if the solar radiation is strong, the photosynthetic rate is overestimated. Now we are evaluating the effects.
5. Summary
ADEOS-II/GLI sensor will give us global data with hyper-spectral bands frequently. These data is effective to monitor global vegetation condition. We proposed the NPP estimation model using ADEOS-II/GLI data. The model is based on the relationships of a new vegetation index (VIPD) with quantum efficiency and vegetation cover ratio. We made NPP maps based on the model around Nara basin in Japan, rain forest area in Malaysia using Landsat/TM data. From the results, the NPP estimated values tend to be bigger than the other model's values and ground measurement data.
We suppose that the tendency is mainly caused by the overestimation of photosynthetic rate. We obtain the rate from the photosynthetic quantum efficiency by assuming the linearity of photosynthetic curves in low solar radiation. However, if the solar radiation is strong, the photosynthetic rate saturates for the solar radiation. To evaluate the effects, we are simulating the photosynthetic curves for whole vegetation canopies. Based on the results, we will modify our model to estimate NPP.
Acknowledgements
This work was supported under the ADEOS-II/GLI project by the National Space Development of Japan (NASDA). Landsat/TM data used in this study is owned by the United States Government and was provided by the Space Imaging EOSAT/NASDA. Rice yields data is provided by the agricultural experiment station of Nara prefecture.
References:
- N. Fujuiwara, K. Muramatsu, S. Awa, T. Hazumi, and F. Ochiai. Pattern expand method for satellite data analusis (in Japanese). Journal of the Remote Sensing Society of Japan, 16(3): 17-34, 1997.
- K. S. Furumi, A. Hayashi, N. Fujiwara, M. Daigo, and F. Ochiai. Pattern decomposition method in the albedo space for Landsat/TM and MSS data analysis. International Journal of Remote Sensing (accepted).
- A. Hayashi, K. Muramatsu, S. Furumi, Y. Shiono, and N. Fujiwara. An algorithm and a new vegetation index for ADEOS-II/GLI data analysis. Journal of the Remote Sensing Society of Japan, 18(2): 28-50, 1998.
- S. Furumi, A. Hayashi, K. Muramatsu, and N. Fujiwara. Relation between vegetation vigor and a new vegetation index based on pattern decomposition method. Journal of the Remote Sensing Society of Japan, 18(3): 17-34, 1998.
- E. K. Gabrielsen, Effects of different chlorophyll concentrations on photosynthesis in foliage leaves. Physiol, Plant., 1:5-13, 1948.
- S.N. Goward and D.G.Dye. Evaluation north American net primary productivity with satellite observations. Adv. Space Res. 7(7):11)165-(11)174, 1987.
- H. Seino Z. Uchijima. Agroclimatic evaluation of net primary productivity of natural vegetation. (1) chikugo model for evaluation net primary productivity. J. Agr. Met/. 40(4):343-352, 1985.
- J. L. Monteith. Climate and the efficiency of crop production in Britain. Philosophical Transactions of the Royal Society of London, B281-277, 1977.
- P. Maisongrande, A. Ruimy, G. Dedieu, and B. Saugier. Monitoring seasonal and interannual variations of gross primary productivity, net primary productivity and net ecosystem productivity using a diagnostic model and remotely-sensed data. Tellus, 47B:178-190, 1995.