| GISdevelopment.net ---> AARS ---> ACRS 1999 ---> Environment |
A Methodology in Detailed
Environment Mapping for Viral Disease Survey
Haja Andrianasolo, Damien
Fages,
Jean-Paul Gonzalez, Philippe Barbazan
Institute of Research for Development (IRD) – FRANCE
Research Center for Emerging Viral Disease (RCEVD)
Center for Vaccine Development (CVD)
Mahidol University at Salaya campus
25/25 Phutthamonthon 4, Nakhonpathom 73170 – THAILAND
Haja Andrianasolo, Kanchana Nakhapakorn
Space Technology Applications and Research (STAR) Program,
Asian Institute of Technology
P.O. Box 4, Klong Luang, Pathumthani 12120, THAILAND
Tel: (662)-524-6125 Fax: (662)-524-5577
E-mail: hajaha@ait.ac.th, frjpg@mahidol.ac.th, knpakorn@ait.ac.th
Abstract
Space Technology, Geographic Information Systems (GIS) and Remote Sensing (RS) have already been widely used in environmental sectors such as the monitoring and the management of natural resources, agriculture, rural and urban planning. Further, this technology can be used to evaluate and model the relationships between environmental factors/indicators and the incidences of viral diseases. Remote sensing by its ability to uncover in a localized way the types of environment: nature, state and spatial organization; and GIS by the links created between spatial data and their related descriptive information (Non-spatial data): socio-economic, cultural and medical. In 1985, the National Aeronautics and Space Administration (NASA) initiated the Biospheric Monitoring and Disease Prediction Project, the aim of which was to determine if remotely sensed data could be used to identify and monitor environmental factors that influence malaria vector populations (Wood et al., 1991). In this paper, we propose a method to extract the maximum amount of information from any given remotely sensed data, to get insights in the relationships between the environment and incidences of viral diseases. The aim being to demonstrate that RS, GIS, RDBMS and Statistical Analyses provide significant contributions to the spatial definition and prediction of vector-borne diseases.
Introduction
Vector-borne diseases have been the most important worldwide health problem for many years and still represent a constant and serious risk to a large part of the world’s population.
Recently, GIS and RS started to be used to evaluate and model the relationships between environmental factors/indicators and the incidences of viral diseases.
GIS is particularly well suited for Epidemiologists in the study of associations between location, environment, and disease (Gesler, 1986). It has been used, for instance, in the surveillance and monitoring of Vector-borne disease (Glass et al., 1995; Beck et al., 1994).
Remotely sensed data have been used in many vector disease studies (Beck et al., 1994; Ahearn et al., 1996). Remote sensing and GIS were used to identify villages at high risk for malaria transmission in the southern area of Chiapas, Mexico (Beck et al., 1994). In Kwara State, Nigeria, a temporal analysis of Landsat Thematic Mapper(TM) Satellite data was used to test the significance of the guinea worm eradication program based on changes in agricultural production (Ahearn et al., 1996).
This paper is part of a current research program on the vector born disease Dengue in Thailand. The data used are Thematic Mapper of 10 th March 1998, in the province of Nakhon Pathom in the Central Plain of the country.
One limiting factor in the use of remote sensing, is that the nomenclatures usually and routinely used are not meeting the requirements of epidemiological and medical researches. They appear to be lacking of resolution and precision, in regards to the levels of details: spatial and taxonomical scales. This is caused by the current state of the art in the problematic linking the vector born diseases to the environment, indeed what nomenclatures, what spatial categories should be used? No actual a priori precise definitions exist as it is still research. Our approach is to solve this lack by the introduction of remote sensing in the very discovery of detailed spatial entities that serve as support of the epidemiological and medical researches in relation to the environment. Remote sensing creates and proposes the different spatial categories existing at the date and location of the studied area. These categories can be used intrinsically, but ultimately have to be labeled environmentally, medico-epidemiologically and/or socio-economically, in a qualitative and/or quantitative way.
Spatial Organization Approach
Principles
Given a studied area, the principle is to organize it spatially, following the type and state on one hand, and the heterogeneity on the other hand, of the environment. The creation of these categories are based on the two aspects of the environment that is potentially and at first sight approachable with remote sensing, namely:
- the types and states, for instance : type is water – state is turbid
- the spatial organization, precisely the heterogeneity, ranging from very disturbed to not-disturbed.
- first: the space is organized following the “types and states” characteristics
- second: each of these “types and states” are re-organized following the “disturbance” characteristics
Classification algorithm
Methodologically speaking, it is using the K-Means statistical algorithm to classify the pixels. This algorithm is organizing the pixels in what is sometimes called “natural” classes, as it is working by minimizing the within-variance (intra-classes : W), against the between-variance (Between-classes : B) in the general equation of the variance : T = B + W (T: Total variance). One question is: how many classes to use. This question is here considered only under the aspect of “how many maximum number of classes should be used, knowing that the area under study is composed of n pixels ?”. Which is meaning we are not discussing such questions as “what should be the optimum number of classes ?”
For this is applied the formula (Andrianasolo, 1990) decomposing an histogram in k classes:
k : the number of classes
n : the size of the area in pixels
The application of the above mentioned approach results in : k = 6 classes.
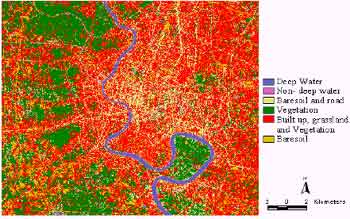
Spectral based - Organization
Classification by heterogeneity (textural features)
Using the method of grey value co-occurrence matrix with a window 7*7, 3 texture features are calculated on the basis of the 6 spectral features of the Thematic Mapper sensor:
Contrast = SNg-1 n=0 n2 {SNgi=1 SNgj=1 p(i,j)}
Entropy = -SiSj p(i,j) log (p(i,j))
p(i,j) : (i,j)th entry in a normalized grey-tone spatial-dependence matrix.
Ng : Number of distinct grey levels in the quantized image.
m: mean of p.
18 textural features are obtained which are used to classify the area in k = 6 classes of “disturbance”.
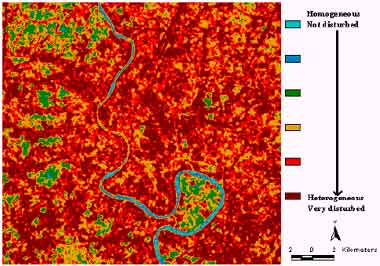
Textural based - Organization
Classification of the area by the results of types/states and heterogeneity approaches
The Spectral based organisation is then re-arranged by the textural one through a GIS modelling. Which ends up in a spatial organization potentially composed of a maximum number of 36 classes.
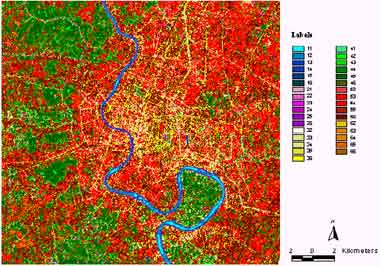
Final Spectral and Textural based organization
Intrinsic Remote Sensing Labelisation of Classes
To give a first stage remote sensing label to the classes, they are analysed following their spectral and disturbance level behaviours.
The spectral behaviours are studied through the knowledge brought by the Tasseled Cap (Crist and Cicone, 1984) model applied to the facts furnished by the actual data resulting from the classification process.
The disturbance is studied by building knowledges concerning their relative levels, very low to very high, through statistical analysis.
The results are presented in the table below.
Water  Vegetation Vegetation  Urdan Urdan | |||||||
|
Spectral Texture |
1 | 2 | 3 | 4 | 5 | 6 | |
| Homogeneous not disturbed |
1 | 11 | 21 | 31 | 41 | 51 | 61 |
| 2 | 12 | 22 | 32 | 42 | 52 | 62 | |
 |
3 | 13 | 23 | 33 | 43 | 53 | 63 |
| 4 | 14 | 24 | 34 | 44 | 54 | 64 | |
| Heterogeneous very disturbed |
5 | 15 | 25 | 35 | 45 | 55 | 65 |
| 6 | 16 | 26 | 36 | 46 | 56 |  | |
Table 1 : Remote sensing Class Labels.
Reading of the types: 66 is class 6 of the spectral based organization at the level 6 of the “disturbance organization”.
The last step of labelisation, is done through a survey and questionnaire, whose sampling frame is dictated spatially and statistically by the modeled reality obtained from the previous remote sensing approach. This last step is aiming at the providing of common understandings and meanings to the classes, plus very precise answers to very clearly defined questions.
Conclusion
Current results obtained in the study of the Dengue show that it is now possible to identify and localize precisely environmental indicators and factors of viral diseases. Furthermore it is also now possible to predict estimates of where the viral diseases could probably and spatially burst, and at what level of incidences. Next developments would concern the introduction of dynamics and time, and enlargement of the study of factors and indicators to social, economical, cultural and ecological parameters.
References
- Ahearn, S.C., De Rooy, C., 1996. Monitoring the effect of dracunculiasis remediation of agricultural productivity using satellite data. International Journal of Remote Sensing, Vol. 17, No. 5, 917-929.
- Andrianasolo H., 1990. Réduire l’incertitude sur unr région rurale: une approche relevant de l’estimation de surface, à travers une modelisation reposant principalement sur les données satellitaires, sous contrainte d’opérationnalité. In : Représentation, Modelisation, Développement – Agropolis/GIS – Systèmes Energétiques – Utilisation de l’Espace – ACCT, pp49-81.
- Beck LR, Rodrigues MH, Dister SW, Rodrigues AD, Rejmankova E, Ulloa A, et al., 1994. Remote sensing as a landscape epidemiologic tool to identify villages at high risk for malaria transmission, Am J Trop Med Hyg., 51: 271-80.
- Crist, E.P., Cicone, R.C., 1984. Application of the Tasseled Cap concept to simulated TM data. Photogrametric Engineering and Remote Sensing, Vol.50, 343-352.
- Gesler, W., 1986. The uses of spatial analysis in medical geography: a review. Soc. Sci. Med, 23, 963-973.
- Glass GE, Schwartz BS, Morgan JM III, Johnson DT, Noy PM, Israel E., 1995. Environmental risk factors for Lyme disease identified with geographic information systems. Am J Public Health, 85: 944-8.
- Wood, B.L., Beck, L.R., Washino, R.K., Hibbard, K.A., Salute, J.S. (1991). Estimating high mosquito-producing rice fields using spectral and spatial data. International Journal of Remote Sensing, Vol.13, No.15, 2813-2826.