| GISdevelopment.net ---> AARS ---> ACRS 1999 ---> Environment |
Observation and Analysis of
Ship Wakes in ERS-SAR and Spot Images
Christian Melsheimer, Hock
Lim, Chaomin Shen
Centre for Remote Imaging, Sensing and Processing (CRISP)
Faculty of Science, National University of Singapore
Blk S17, Lower Kent Ridge Road, Singapore 119260
Tel: (65) 8746587 Fax: (65) 7757717
E-mail: crscm@nus.edu.sg
SINGAPORE
Keywords: Ship Wake, Synthetic Aperture Radar,
ERS, SPOTCentre for Remote Imaging, Sensing and Processing (CRISP)
Faculty of Science, National University of Singapore
Blk S17, Lower Kent Ridge Road, Singapore 119260
Tel: (65) 8746587 Fax: (65) 7757717
E-mail: crscm@nus.edu.sg
SINGAPORE
Abstract
In this paper, we give an outline of the current understanding of the imaging of ship wakes by a spaceborne SAR and by a spaceborne high-resolution optical sensor. We present examples drawn from the analysis of about 400 ship wakes in ERS SAR images and about 100 ship wakes in SPOT multispectral and panchromatic images. Our analysis shows that, consistent with current understanding of the imaging of ship wakes, the visibility and appearance of ship wake features depend on local parameters such as wind speed or sea state, heading direction of the ship relative to the looking angle (ERS SAR) or sun angle (SPOT). As a consequence, in ERS SAR images the Kelvin wake is visible in some form in only about 17% of cases, whereas the turbulent wake practically always shows up in both SPOT and ERS SAR images. We further discuss features which are not readily explained by current theory, such as Kelvin-wake signatures in ERS SAR images which are narrower than predicted, or dark lines forming a V-shape within the Kelvin-wake signature in SPOT images.
Introduction
A moving ship generates a wake which consists of a characteristic surface wave pattern confined to a wedge-shaped region behind the ship (Kelvin wake), and a turbulent wake along the track of the ship. Such a ship wake can often be seen in images acquired by the synthetic aperture radar (SAR) aboard the satellites ERS-1 and 2 or by the High Resolution Visible Scanner (HRV) aboard the SPOT satellites. The hydrodynamics of ship wakes is still an object of ongoing research as it is relevant for the construction of ships with minimal wave resistance, while thorough understanding of ship wakes in satellite images is relevant for correctly interpreting the images with the aim of monitoring ship traffic and compiling ship statistics.
Ship Wakes
Wave Pattern
The wave pattern generated on the water surface by a moving disturbance was first theoretically explained by Lord Kelvin, hence the name Kelvin wake. Without citing the details of the solution of the classical problem, we give its basic features for a point-like disturbance moving with constant speed V in a straight line on the surface of water of uniform depth D (Newman, 1977). For deep water, which in this context is defined by D>>2V2/g, where g is the acceleration of gravity, the wave pattern is confined to a wedge-shaped region behind the ship with a half angle b of 19.5° (the wake angle). Note that this angle is independent of the speed of the disturbance. The wave pattern consists of diverging and transverse waves, as sketched in Fig. 1. The propagation direction of the waves in the wake with respect to the heading of the disturbance is between 0° and 35.25° for the transverse waves, and between 35.25° and 90° for the divergent waves, while the wavelength decreases with increasing angle. The outward edge of the wedge, where transverse and divergent waves are superimposed to form so-called cusp waves, is usually the region of the wake with highest wave amplitudes, called cusp region or cusp lines.
Fig. 1: Schematic sketch of a ship wake (adapted from Hennings et al., 1999)
The qualitative features of this pattern are preserved if the point like disturbance is replaced by a disturbance of finite spatial extent which is more suitable to describe a real ship. However, the region around the ship and behind the ship up to a distance of several shiplengths (local wave disturbance region) shows a complex combination of breaking waves, bow and stern waves, very much depending on the speed, the shape and the propulsion system of the ship. The distribution of waves amplitudes behind the local disturbance region (free wave pattern region) depends on the ship as well. Thus, e.g., either the transverse or the diverging waves may dominate, and the cusp line may be more or less prominent. When the depth D approaches U2 /g, the wedge widens: For D=2V2/g , the wake angle is b=20.5° and for D=1.2 V2/g, b>35° , eventually approaching 90° at the singularity. D= V2/g (Havelock, 1908). For shallow water which in this context is defined by D<2V2/g, the wave pattern is very different: There are no transverse waves, and no cusp lines. The divergent waves form a wedge whose half angle depends on the water depth and on the speed of the ship, sinb=(gh)0.5/V.
For a swift ship with V=10 m/s (20 kn), V2/g=5.6 m, thus the deep water limit is valid when D exceeds about 10 m, which is generally the case for ship routes in the sea. The wavelength of the longest waves in the Kelvin wake is 64 m for V=10 m/s and 16 m for V=5 m/s.
Turbulent Wake
The linear and angular momentum imparted to the water by the turning screws as well as by the wave drag and the drag of the hull gives rise to a turbulent wake in the track of this ship. Its width w increases very slowly with the distance x from the ship, Tunaley and Buller (1989) cite w~x1/4 . The turbulence can persist for several minutes, thus a turbulent wake can be several kilometers long. The exact structure depends on the ship and the screws.
Imaging of Ship Wakes by the SAR of the ERS-1/2 Satellites
The European Remote Sensing satellites ERS-1 and 2 orbit the earth in 780 km height and among other sensors carry a synthetic aperture radar (SAR). The SAR operates at a frequency of 5.3 GHz (C-band microwaves) and has a ground resolution of 25 m.
In order to understand how ship wakes can be imaged by the ERS SAR, we have to take into account that the SAR senses only the short-scale roughness of the sea surface: The radar backscattering from the sea surface at incidence angles typical for SAR (i.e., 20° to 60°) is caused by short surface waves (Bragg waves) which travel in or opposite to the SAR antenna look direction (range direction) and which have a wavelength of lB=l/2sinq , where l is the radar wavelength and q is the incidence angle. The backscattered intensity is proportional to the spectral energy of the Bragg waves (Valenzuela 1978). A common measure for the backscattered intensity is the normalized radar backscatter cross section (NRCS), which is represented in SAR images as a grey level. In the case of the ERS SAR, the radar wavelength is l=5.7 cm, the incidence angle is between 20.1° and 25.9° , thus the Bragg wavelength lB is between 8.2 cm and 6.5 cm.
The waves of a Kelvin wake are much longer than the Bragg wavelength, but they modulate the Bragg waves in several ways. The modulation mechanism which is most important for spaceborne SAR imaging of ship wakes is the tilt modulation (Hennings et al., 1999): the short waves are tilted by longer waves, such that the local incidence angle as well as the local Bragg condition are modified which in turn changes the NRCS (see Fig. 2). A tilt towards the SAR results in an increase of the NRCS, and a tilt away from the SAR results in a reduction of the NRCS, whereas a tilt at right angles to the SAR look direction does, to first order, not affect the NRCS. Thus, range-traveling waves would appear brighter on their fore side and darker on their rear side in a SAR image, provided the wavelength is larger than the size of the SAR resolution cell. Waves traveling at right angles to the look direction, i.e., in azimuth direction, would not become visible by the tilt modulation. Since the NRCS enhancement due to a tilt of the water surface towards the SAR is greater than the NRCS reduction due to a tilt away from the SAR, both effects do not cancel each other if the size of a resolution cell is larger than the wavelength (i.e. if one pixel in the SAR image averages over several wavelengths, which is often the case for Kelvin wakes and ERS SAR). The waves of a Kelvin wake that travel in or opposite to the look direction can thus cause an NRCS enhancement even if they cannot be resolved individually, provided their slopes are large enough. In practice, mainly the cusp lines, where wave amplitudes and slopes are highest, show up as bright lines in SAR images when the cusp waves travel in or opposite to look direction. However, the visibility of the cusp lines becomes the lower, the higher the wind speed is.
Fig. 2: Tilt modulation of Bragg waves (adapted from Robinson, 1994)
The turbulent wake also modifies the Bragg waves in the following ways: (1) the turbulence acts like an additional viscosity (eddy viscosity) that dampens short surface waves (Milgram et al., 1993); (2) surface-active substances tend to be gathered in the turbulent wake as they are skimmed from the water column by rising bubbles, forming surface-active films that dampen short surface waves (Peltzer et al., 1992). The turbulent wake would therefore have a reduced NRCS and thus show up as dark in the SAR image. The investigation by Peltzer et al. (1992) has shown that the surface films persist for a longer time than the turbulence. In case of very calm conditions, however, the turbulent wake can be rougher than the surrounding sea due to the currents and eddies in the wake. Thus is would appear brighter than the background in the SAR image. When the sea surface is covered by extensive surface films (that dampen the short surface waves), the turbulence of the wake can break up these films. This would as well result in the turbulent wake appearing brighter in the SAR image than the background.
The backscatter from the ship itself need also be considered. Since a ship is mainly made of metal and has structures with right-angled corners, it is an excellent radar reflector and causes a very bright spot in a SAR image. If the motion of the ship has a radial component with respect to the radar, the corresponding spot in the SAR image appears shifted in flight (azimuth) direction. The reason is that the (moving) SAR obtains its azimuth resolution by using the Doppler shift of the returned signals, assuming targets at rest. A radial motion of a ship causes an additional Doppler offset which then results in the echo's being mapped to a "wrong" position in the image.
We shall now present examples from a set of 400 ship wakes in ERS SAR images that we have investigated. The ship wakes were identified as a combination of linear structures with a bright spot near one end. Fig. 3 shows 3 images where one cusp line (Kelvin arm) is visible. The second Kelvin arm is not visible because its cusp waves do not propagate in or opposite to range direction. In Fig. 3b, the azimuth (flight direction) displacement of the ship's echo (bright dot, upper left) is clearly visible. Note that in all 3 images, a dark turbulent wake is visible. Note also that in Fig. 3a and b, the whole sector between the turbulent wake and the Kelvin arm is slightly brighter than the background. The reason is that not only the cusp waves, but also the divergent waves of this half of the Kelvin wake have enough slope to produce more tilt modulation than the surrounding water surface. Since only 17% of all investigated wake images showed one or two Kelvin arms, it can be concluded that in most cases, either the look direction of the SAR is not favorable, or the wave amplitudes and slopes even in the cusp region are not sufficient to produce a measurable tilt modulation. The wave pattern was visible in only two cases. The wake angles we observed in the images which show a Kelvin arm are smaller than 20° in about 20% of cases. This cannot be caused by intermediate water depths, since this would cause the angle to widen. A possible reason is that in such cases, the cusp waves are not more pronounced than the divergent waves within the wedge, but the propagation direction of the cusp waves is less close to look direction than the propagation direction of certain divergent waves within the wedge. These waves would then cause a bright line within the wedge.
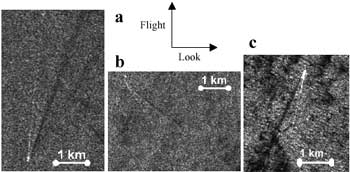
Fig. 3: ERS SAR images with Kelvin arms of ship wakes. (a) ERS-2, South of Singapore, 21 Oct 1997, 1544 UTC; (b) ERS-2, Straits of Malacca, 25 Apr 1996, 0337 UTC; (c) ERS-1, South China Sea, 9 Apr 1996, 0307 UTC. (Ó ESA 1996, 1997)
A turbulent wake, in contrast, was found in all investigated cases. Fig. 4a shows a typical dark turbulent wake, as encountered in about half of the investigated cases. Fig. 4b shows a long turbulent wake which is visible as a bright line when it crosses the black patches. These patches are very likely surface films which are broken up by the turbulence of the wake. Such a bright turbulent wake was found in about one third of the investigated cases; in the remaining one sixth of cases a combination of dark and bright turbulent wake was found. Fig. 4c shows a turbulent wake that consists of two parallel dark lines. This can be explained by surface films gathered by convergent surface currents at the edge of the wake because the screws of a ship usually rotate outwards.
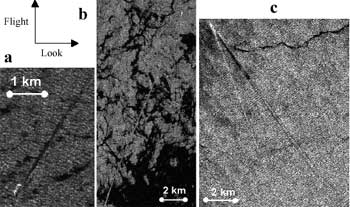
Fig. 4: ERS images of turbulent wakes. (a) ERS-2, Gulf of Thailand, 8 Apr 1996, 0338 UTC; (b) ERS-1, south China Sea, 9 Apr 1996, 0307 UTC; (c) ERS-1, Straits of Malacca, 4 May 1996, 1559 UTC. ( Ó ESA 1996)
Imaging of Ship Wakes by the Spot Satellites
The SPOT satellites (Satéllite pour l'Observation de la Terre) have an orbit height of 832 km and carry a High Resolution Visible scanner (HRV). The HRV collects radiance data in optical near infrared wavelengths either in a broad-band (panchromatic) mode with a resolution of 10 m, or in a three-band (multispectral) mode with a resolution of 20 m.
The imaging of ship wakes by the optical sensor HRV shows some similarities to the imaging by SAR. The reason is that also for the HRV, the sea surface roughness plays a role in the imaging of the sea surface. The imaging mechanism to consider here is sun glitter, i.e. the specular reflection of sun light by the sea surface into the sensor. Depending on the local geometry, i.e., the sun angle and the looking angle of the HRV, either a flat area, or an area which is tilted in the appropriate angle and direction, might cause sun glitter. Consequently, either the flat or the tilted area appears brighter in the image, and the wave pattern of a ship wake can become visible as a pattern with brighter or less bright image intensity. In a similar way, rough areas, i.e., areas with tilted facets, can appear brighter or darker in the image than smooth areas do, depending on the local geometry (Cox and Munk, 1954). This implies that a turbulent wake, characterized by smaller wave amplitudes and slopes than the surrounding water, can become visible in the image as a bright or as a dark line. This can even change within one image, because of different local looking angles. Furthermore, the breaking waves and white water near ship can show up in the image due to the high reflectance. The ship itself is in general not particularly bright.
In the following, we present some typical examples out of a set of about 100 ship wakes in SPOT images. Fig. 5a shows two wakes with distinct cusp lines and turbulent wakes; the transverse waves of one wake are also very distinct. (The white "garlands" are surface films that cause strong sun glitter.). In Fig. 5b, the transverse as well as the divergent waves are clearly visible. Moreover, there are bright radial lines within the Kelvin wake that are arranged in a fan-shaped pattern. They can also be explained by sun glitter: Since the propagation direction and wavelength of the waves in a Kelvin wake is constant along radial lines, a given sun angle can pick out one or several of such lines as having the right slope and orientation to cause sun glitter, as was shown by Munk et al. (1987). Internal waves, which may also cause a fan-like pattern, can be ruled out in this case, as the position is near Singapore, where the water column is usually not much stratified. Fig. 5c shows a wake with distinct transverse waves, and with a turbulent wake that consists of two dark lines, similar to the turbulent wake in the SAR image in Fig. 4c, and it can be explained in the same way. Fig. 6 shows distinct Kelvin wakes, with strong divergent waves in one case. The turbulent wakes are bright, as are some surface film filaments. Most remarkable are the two dark lines within the Kelvin wake (upper wake) which are not the cusp lines. They seem to persist longer than the wave pattern, yet it is unlikely that they are caused by surface films, as throughout the image, surface films are bright. At present, we have no convincing interpretation of this phenomenon.
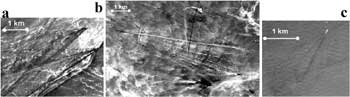
Fig. 5: SPOT panchromatic images. (a) Near Singapore, 18 Oct 1995, 0345 UTC; (b) South of Singapore, 18 Oct 1995, 0345 UTC; (c) Near Brunei, 25 Oct 1995, 0309 UTC. (Ó CNES 1995)
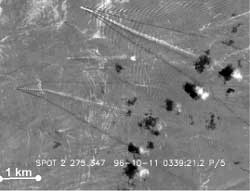
Fig. 6: SPOT panchromatic image, South of Singapore, 11 Oct 1996, 0339 UTC. ( Ó CNES 1995)
Summary and Conclusion
Ship wakes are imaged by ERS SAR and SPOT because they generate and modify surface waves. The turbulent wake is almost always visible on ERS SAR and SPOT images as a dark or bright line. The individual waves of the Kelvin wake are rarely seen on ERS SAR images since the resolution is not sufficient in most cases, in panchromatic SPOT images they are more often imaged due to the higher resolution. Imaging of the cusp lines by ERS SAR strongly depends on the propagation direction and the amplitude of the cusp waves, therefore they are often invisible. The ship's backscatter is always very conspicuous in ERS SAR images of the sea. In order to monitor ship traffic, SAR is better suited than optical sensors, since it penetrates clouds and does not depend on sunlight. In particular, the turbulent wake and the ship's backscatter are the features to be used for detecting ships.
References
- Buller, E.H., Tunaley, J.K.E., 1989. The effect of the ships screws on the ship wake and its implication for the radar image of the wake. Proc. IGARSS 89, Victoria, B.C. Canada, pp. 362-365.
- Cox, C., Munk, W.H., 1954. The measurement of the roughness of the sea surface from photographs of the sun's glitter. J. Opt. So. Am., 44, pp. 838-850.
- Havelock, T.H., 1908. The propagation of groups of waves in dispersive media, with application to waves on water produced by a travelling disturbance. Proc. Roy. Soc. London, A81, pp. 398-430.
- Hennings, I., Alpers, W., Romeiser, R., 1999. Radar imaging of Kelvin arms of ship wakes. Int. J. Remote Sens., 20 (13), pp. 2519-2543.
- Milgram, J.H., Peltzer, R.D., Griffin, O.M., 1993. Supression of short sea waves in ship wakes: measurements and observations. J. Geophys. Res., 98 (C4), pp. 7103-7114.
- Munk, W.H., Scully-Power, P., Zachariasen, F., 1987. Ships from space (The Bakerian Lecture, 1986). Proc. Roy. Soc. London, A412, pp. 231-254.
- Newman, J.N., 1977. Marine Hydrodynamics, MIT Press, Cambridge, MA. USA, pp. 270-327.
- Peltzer, R.D., Griffin, O.M., Barger, W.R., Kaiser, J.A.C., 1992. High-resolution measurement of surface-active film redistribution in ship wakes. J. Geophys. Res., 97 (C4), pp. 5231-5252.
- Robinson, I.S., 1994. Satellite Oceanography, Praxis Publishing, Chichester, U.K., pp. 363-372.
- Valenzuela, G.R., 1978. Theories for the interaction of electromagnetic and oceanic waves - a review. Boundary-Layer Meteor. 13, pp.61-85.