| GISdevelopment.net ---> AARS ---> ACRS 1999 ---> Environment |
Feasibility Analysis for
Vegetation Classification from Time Series NDVI data with “Green Census”
data
Keiko Kokubu1 ,
Krishna Pahari1 , Masayuki Tamura2 and Yoshifumi
Yasuoka1
1: Institute of Industrial Science, University of Tokyo
4-6-1 Komaba, Meguro-ku, Tokyo 153-8505 JAPAN
Tel. (81)-3-5452-6417 Fax.(81)-3-5452-6417
E-mail: kokubu@skl.iis.u-tokyo.ac.jp
2: National Institute for Environmental Studies
16-2 Onogawa, Tsukuba, Ibaraki Japan
Tel.(81)-0298-50-2479 Fax.(81)-0298-58-2645
Keywords: Time series NDVI, NOAA/AVHRR,
Vegetation classification1: Institute of Industrial Science, University of Tokyo
4-6-1 Komaba, Meguro-ku, Tokyo 153-8505 JAPAN
Tel. (81)-3-5452-6417 Fax.(81)-3-5452-6417
E-mail: kokubu@skl.iis.u-tokyo.ac.jp
2: National Institute for Environmental Studies
16-2 Onogawa, Tsukuba, Ibaraki Japan
Tel.(81)-0298-50-2479 Fax.(81)-0298-58-2645
Abstract
Vegetation classification based on a time series NDVI data from NOAA/AVHRR is investigated with the so-called “Green Census” data to evaluate the feasibility of temporal analysis of satellite data for vegetation classification. A time series of NDVI data has been popularly used for vegetation type classification since it reflects the phenological features of vegetation. It is, however, pointed out that it is difficult to validate the classified result because of the lack of actual vegetation data. Also the sensitivity of the NDVI data to vegetation classification has not been fully investigated. In this paper, vegetation classification based on a time series NDVI patterns from NOAA/AVHRR is compared with the actual vegetation data (“ Green Census” data), and the feasibility of vegetation classification from time series NDVI is investigated.
Introduction
Global environment issues such as desertification, acid deposition or deforestation have been critical all over the world, and the necessity for monitoring land cover changes is pointed out. Among a wide variety of land cover parameters, vegetation distribution is especially important for assessing the impact of human activities on the ecosystem. Therefore monitoring of vegetation cover conditions and their changes is essential for the management of environment in both of the regional and global scale. It is, however, difficult to carry out land cover survey over extensive areas only with the ground survey. Remote sensing from satellite is expected to be one of the efficient methods for observing vegetation cover conditions.
There have been many methods to analyze satellite data for land cover classification. They are categorized in two approaches including a spectral analysis approach and a temporal analysis approach. In the first approach, usually, multi-spectral data with high spatial resolution such as LANDSAT TM is used for classification based on the spectral characteristics of the images. In the second approach, on the other hand, time series data is used for classification based on the temporal characteristics of the images. Satellite data used in the latter approach has usually low spatial resolution, however, it can observe wider areas more frequently, and it enables us to utilize temporal characteristics of the target categories for classification. One of the typical examples of this approach is a time series of NOAA/AVHRR data. In this study, first, the feasibility of applying Fourier analysis of a time series NDVI data from NOAA/AVHRR (1), (2) to vegetation classification was evaluated.
Two common problems, however, are pointed out in the conventional vegetation classification in methods. First, classification results can not be fully validated because of the lack of good ground truth data. Secondly, the suitable classification system for vegetation categories from remote sensing has not been established yet. Here, the effectiveness of the classification based on the phenology of vegetation is validated with so called “Green Census” data that is actual vegetation classification data set with the scale of 1/50,000 covering whole areas of Japan archipelago. Also appropriateness of vegetation classification system from remote sensing is investigated.
Time series NDVI data and “Green Census” data
In this study a time series NDVI data derived from NOAA/AVHRR was used to detect phenological features of vegetation and the classified results were compared with precise actual vegetation data set.
Monthly NDVI Data
A time series NDVI images was produced from monthly composite NOAA/AVHRR data set from 1996 and 1997 by National Institute for Environmental Studies. The images cover most of the East Asian region with a spatial resolution of 1.1km. Geometric correction was performed with the ground control points (GCPs).
"Green Census" Data
The "Green Census" data has been produced by Japan Environment Agency around once five years since 1973, and it includes actual vegetation maps with a scale of 1/50,000, and their digital format data (vector data). It covers whole Japan archipelago prefecture by prefecture, and the number of vegetation categories in the actual vegetation map is as large as 766. Here, “Green Census” data is registered with a time series NDVI data and compared together to evaluate the accuracy and the sensitivity of vegetation classification.
Vegetation Classification with Fourier Transform Analysis
Fourier Spectrum of NDVI Time Series Data
Monthly NDVI time series data V(t) at a certain NDVI image coordinate of (x, y) is a function of time t ,which is in discrete unit of month and has a range from 1 to 24 (2 years). With Fourier Transform. V(t) is written in a form of discrete Fourier series such as
where n-th imaginary Fourier coefficient f(n) is given by
The power density spectrum P(n) of V(t) is given by
Here, Fourier power density spectra was calculated for all the pixels in the NDVI images. Figure 1 shows typical Fourier power density spectra calculated for five different land cover categories. Each Fourier coefficient is used to remove the noise of the high frequency, and to extract periodicity at the same time.
Figure 1 Examples of Fourier power spectra of 24 months NDVI data.
Preprocessing
Original NDVI values in each pixel have noise due to the cloud effect or the sensor noise. First, noise of low frequency was removed with the Median Filter where each NDVI value is replaced by the median value of three successive NDVI values. Noise of high frequency was removed by depositing the 3-th, 5-th to 24-th Fourier power density spectrum calculated as shown in the previous section. Moreover, DEM data were taken into consideration to get rid of the influence of the shadow by the geographical features.
The periodicity of the NDVI value is extracted as 0-th to 2-th and 4-th Fourier power density spectrum. Vegetation distribution due to the height above sea level was also considered utilizing the DEM data
Classification
In this study the number of classified categories which can be distinguished by satellite data is supposed to be beyond 30,therefore training area is set automatically from actual vegetation data by random sampling. As phenology of vegetation is the key characteristics of land cover classification, 0-th, 1-th, 2-th and 4-th power spectrum, corresponding to averaged value of two years period , 12 months period component and 6 months period component are used. Classification is done with maximum likelihood classification. Figure 2. shows an example of land cover classification with Fourier spectrum.
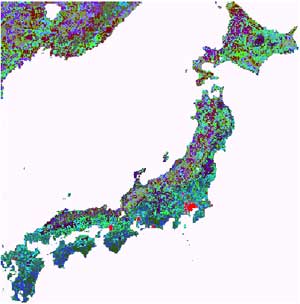
Figure 2 An example of vegetation classification with Fourier spectrum.
Comparison of Classified Vegetation Distribution and “Green Census” Data
There are 766 categories in "Green Census" data which is used as the precise validation data. It is impossible to categorize all the vegetation classes in the validation data directly from the satellite data, therefore 766 categories are stratified according to phenology.
Original vegetation vector data whose precision is about 100m is converted into 50m mesh data. It is integrated to the 1km mesh data to be compared with the result of classification. As the representative vegetation for 1km mesh, the following three are considered; the vegetation that occupies the maximum area, the vegetation that contributes most to the change of NDVI and the rate of vegetation as the index. Figure 3 shows an example “Green Census” data for Osaka Prefecture. Percentage of the area of the classified categories corresponding to each actual vegetation categories is calculated.
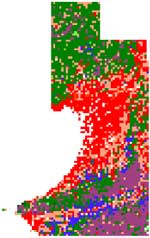
Figure.3.” Green Census” data Osaka (1km mesh)
Conclusions
Vegetation classification based on the time series NDVI data from NOAA/AVHRR is investigated with the so-called “Green Census” data, and the feasibility of time series NDVI data for vegetation classification was evaluated.
There have been many methods for vegetation classification, however, a good quality vegetation map has not been derived yet from remotely sensed data. One major reason for it is that the good quality ground truth data is not available. In this study newly produced digital map of actual vegetation is used for validation of the classified results. Also it is used to organize reasonable vegetation classification system from remotely sensed data. Although the results is still at the preliminary stage it is expected to extend the developed method and a classification system for more extensive areas covering East Asian region.
Acknowledgments
Authors would like to express our thanks to the Japan Environment Agency for providing us with the “Green Census” data, and also thanks to National Institute for Environmental Studies for providing us with the NDVI data set .
References
- R.S.DeFies, et.al.: NDVI-derived land cover classification at a global scale,Int.J.Remote Sens,Vol.15,No.17,pp3675-3586,1994.
- M. Sugita and Y. Yasuoka : Land Cover Classification of East Asia Using Fourier Spectra of Monthly NOAA AVHRR NDVI Data,IGARSS(1996):