| GISdevelopment.net ---> AARS ---> ACRS 1999 ---> Disasters |
Backscattering
Characteristics of Airborne SAR Images for Seismic Vulnerability
Assessment in Urban Areas
Hisashi Aoki, Masashi
Matsuoka , Fumio Yamazaki
Earthquake Disaster Mitigation Research Center
The Institute of Physical and Chemical Research (RIKEN)
2465-1 Mikiyama, Miki, Hyogo 673-0433, Japan.
Tel: +81-794-83-6632, Fax: +81-794-83-6695
Email: aoki@miki.riken.go.jp
and
Seiho Uratsuka, Tatsuharu Kobayashi, Makoto Satake
Communications Research Laboratory (CRL)
Ministry of Posts and Telecommunications
4-2-1 Nukui-Kitamachi, Koganei, Tokyo 184-8795, Japan
Tel: +81-423-27-7465, Fax: +81-423-27-6665
AbstractEarthquake Disaster Mitigation Research Center
The Institute of Physical and Chemical Research (RIKEN)
2465-1 Mikiyama, Miki, Hyogo 673-0433, Japan.
Tel: +81-794-83-6632, Fax: +81-794-83-6695
Email: aoki@miki.riken.go.jp
and
Seiho Uratsuka, Tatsuharu Kobayashi, Makoto Satake
Communications Research Laboratory (CRL)
Ministry of Posts and Telecommunications
4-2-1 Nukui-Kitamachi, Koganei, Tokyo 184-8795, Japan
Tel: +81-423-27-7465, Fax: +81-423-27-6665
In this study, we evaluated the relationship between the structure of an urban area and the backscattering characteristics using the CRL/NASDA airborne synthetic aperture radar (PI-SAR) which observed the Tokyo Metropolitan area, for the purpose of developing building inventory and grasping the elements of seismic risk. The specific buildings were selected from areas which show predominant intensities of HH, VH and VV polarizations. The polarization characteristics of these areas were examined from co- and cross polarization signatures computed from the PI-SAR data and were confirmed by field surveys and aerial photographs.
Introduction
The risk of seismic damage in urban areas is closely related to the structures and materials of buildings and distance between them. Hence it is important to study the plan, elevation and structure of buildings in urban areas in order to evaluate seismic vulnerability. This evaluation is very important for the prediction of human casualties, for the mitigation of disaster. Moreover, it is effective for the recovery and reconstruction of society. Inventory of structures in urban areas can be obtained by a field survey. However, a large amount of time and effort is required to do so. Remote sensing by aircraft is one of the most promising technologies for monitoring large areas covering the earth's surface. Airborne survey methods can be an effective solution since they can provide spatial information about a large area quickly and easily. Airborne SAR (Synthetic Aperture Radar) provides high-resolution images, which can be used for identifying individual buildings. The airborne SAR is able to provide full-polarization information. The complete polarization characteristics are obtained by the analysis of polarimetoric SAR images. The polarization characteristics are highly suitable for the identification of detailed surface conditions of objects because they differ according to factors such as building materials and the density of city blocks. If we can identify the urban structures on the basis of their areas from the polarization characteristics, the results can be used in the seismic vulnerability assessment. This study investigated backscattering signatures from the polarized characteristics of man-made objects such as low-rise buildings in a high-density area and tall buildings in a commercial area.
Airborne SAR images
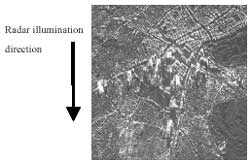
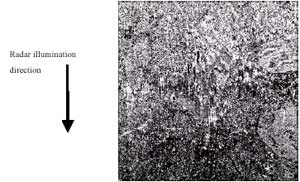
The Communications Research Laboratory (CRL) of the Ministry of Posts and Telecommunications of Japan and the National Space Development Agency of Japan (NASDA) have developed in collaboration an airborne high-resolution multiparameter synthetic aperture radar (Polarimetric and Interferometric SAR: PI-SAR). Mounted on an airplane, this synthetic aperture radar is a dual-frequency radar operating at L-band and X-band frequencies with polarimetric functions. The main characteristics of PI-SAR are listed in Table 1. The PI-SAR was used to observe the Tokyo Metropolitan area on September 30, 1997, and X-band, full polarization data were acquired. In this study, we used the data for a 3km X 3km area in Shinjyuku, Tokyo. The backscattering intensity images of HH and VH polarization are shown in Fig.1. Comparing the backscattering intensity images in HH, HV, VH, and VV polarizations, it was revealed that the intensities of co-polarization (HH, VV) were higher than those of cross-polarization (HV, VH), and HH polarization intensity was the maximum. High-rise buildings are indicated by strong backscattering reflection. Whereas low-rise buildings, forests on parks and ponds are indicated by weak backscattering reflection. Moreover, even in the case of areas which contain similar types of buildings, the predominant polarization differs. Then, a color composite image (red, green and blue are allocated to HH, VH and VV polarized intensity images, respectively) is created. The predominant polarization differs between each super-high-rise building and differs in segments, even within one super-high-rise building.
Table 1 Characteristics of PI-SAR X-band
| Frequency | 9.55 GHz | ||
| Bandwidth | 100 MHz | ||
| Antenna, Length x Width | 1.05 m L x 0.19 m W | ||
| Off-nadir Look Angle | 10 – 75 deg. (Variable) | ||
| Observation mode | 2-ch. Polarimetry/ Interferometry |
4-ch. Polarimetry |
6-ch. Polarimetry& Interferometry |
| Swath Width (Observed from12,000 m) |
19.6/42.5 km | 8.2/19.6 km | 4.3/11.9 km |
| Slant Range Resolution | 1.5/3 m | ||
| Azimuth Resolution (4/8-look) | 1.5/3 m | ||
 |
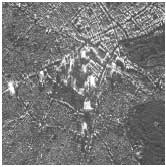 |
| (a) HH polarization | (b) VH polarization |
| Fig.1 Backscattering intensity images of PI-SAR | |
Polarization Characteristics in Urban Areas
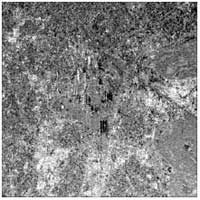
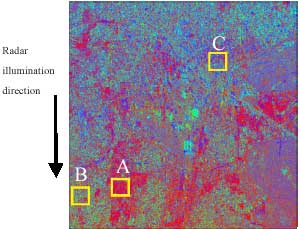
The differences in predominant polarization in urban areas were evaluated using ratio values Rhh, Rvh, and Rvv expressed in Table 2. The ratio value is calculated from the average of a 5 x 5 pixel window. The ratio images are shown in Fig.2. The white color in each image indicates areas where the ratio value is high. The Rhh image showed that the ratio of HH polarization in the residential areas is high compared with in the commercial areas where high-rise buildings exist. The residential areas are divided roughly into areas where the Rhh value is very high and areas where it is not. The Rvh image revealed that the ratio of VH polarization is intricately distributed regardless of low-rise or high-rise building areas. The remarkably low values for buildings in residential areas are found in some areas. The Rvv image revealed that the ratio of VH polarization in residential areas was low, and remarkably high in parts of commercial areas. Higher buildings displayed a higher VV polarization-ratio.
Table 2 Ratio values of predominant polarized intensity
| Ratio value | expression | Characteristics |
| Rhh | HH / Q | Ratio of HH polarized intensity to total polarized intensity |
| Rvh | VH / Q | Ratio of VH polarized intensity to total polarized intensity |
| Rvv | VV / Q | Ratio of VV polarized intensity to total polarized intensity |
 |
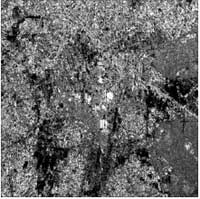 |
| (a) Rhh | (b) Rvh |
 | |
| (c) Rvv
Fig. 2 Images of polarization ratio | |
Polarization Signature of Buildings
The detailed polarization characteristics were evaluated using the polarization signature of representative areas. These areas labeled Max(Rhh), Max(Rvh), and Max(Rvv) were selected from the pixels which have maximum Rhh, Rvh, and Rvv values, respectively, in the residential and commercial areas. Max(Rhh), Max(Rvh), and Max(Rvv) are shown in Fig.3 (a)-(c), respectively. Both co- and cross-polarization signatures were computed and generated directly from the Stokes Matrix for the selected areas. In this study, the Stokes Matrix is considered to be an average Stokes Matrix within a 5 x 5 pixel window. The signature has 91 samples (-45 to 45 degrees ellipticity angle) and 181 lines (0 to 180 degrees tilt angle). Details of the wave polarization generation can be obtained be referring to Van Zyl et al. (1987) and Zebker (1987). The relationships among the HH, VH, and VV polarized intensity of each area and the maximum received intensity in each case which are computed from co- and cross-polarization data are shown in Fig.4. The co- and cross-polarized signatures of each extracted pixel are shown in Fig.5.
 |
 |
| (a) Max(Rhh) in area A | (b) Max(Rvh) in area B |
 | |
| (c) Max(Rvv) in area C | |
| Fig.3 Areas selected from the pixels which have the maximum value of polarization ratios | |
In Fig.4 (a) and Fig.5 (a), the cross-polarized intensity of Max(Rhh) is very low compared with the co-polarization intensity. As expected, Max(Rhh) exhibited co- and cross-polarized signature shapes similar to those of the simple backscattering model from an object with a horizontal component. Hence, it is assumed that the area near Max(Rhh) must be the scattering object to the radar illumination direction. Therefore, it is suggested that the area is a residential one where buildings are horizontal with respect to the radar illumination direction. In Fig.4 (b) and Fig.5 (b), the entire polarized intensity of Max(Rvh) is very low compared with those of Max(Rhh) and Max(Rvv). Max(Rvh) exhibited co- and cross-polarized signature shapes similar to those of the simple backscattering model from an object with a 45 degree inclined corner reflector component. In Fig.4 (c) and Fig.5 (c), Max(Rvv) exhibited co- and cross-polarized signature shapes similar to those of the simple backscattering model from an object with a vertical component. Since the Rvv value is high for tall buildings in commercial areas, it is suggested that VV polarization intensity has a relation with the building height.
Fig.4 Relationship between HH, VH, and VV polarization intensities for selected areas and maximum received intensities which are computed from co- and cross-polarizations
| Co-polarization | Cross-polarization |
 | |
| (a) Max(Rhh) area | |
 | |
| (b) Max(Rvh) area | |
 | |
| (c) Max(Rvv) area | |
| Fig.5 Co- and cross-polarization signatures for three areas | |
Comparison with Field Survey and Aerial Photographs
The characteristics of the building in each area extracted from Fig.3 were confirmed by the results of the field survey, and those of surrounding structures in urban areas were confirmed based on aerial photographs. The field survey was carried out in August 1999. The aerial photographs were mostly taken with SAR images at the same acquisitions (October-November, 1997). The actual structure at the Max(Rhh) area was found to be a wooden house with is a large wall almost horizontal to the radar illumination direction due to the field survey results. The surroundings were confirmed to be a highly dense residential district by the aerial photographs (Fig.6 (a)). The actual structure at the area of Max(Rvh) was confirmed to be a low-rise building built at a 45 degree inclination to the radar illumination direction based on the field survey results. It is confirmed from the aerial photograph that this area is a residential district of similar environment to that of the area with Max(Rvh) (Fig.6 (b)). The actual structure in the area Max(Rvv) is a tall and slender high-rise building compared with the surrounding buildings. On the basis of the aerial photograph (Fig.6 (c)), it is confirmed that this area is commercial district unique to metropolises.
 | |
| (a) Area A around Max(Rhh) | |
 |
 |
| (b) Area B around Max(Rvh | (c) Area C around Max(Rvv) |
(© Nakanihon Air Service Co.,
Ltd.)
Conclusion
In this paper the relationship between the structure of urban areas and the backscattering characteristics was discussed using airborne SAR full-polarized images taken in the Tokyo Metropolitan area. As a result, it was suggested that the predominant polarization intensity differed with the height, form, and alignment direction of the buildings. Future study will be carried out to investigate the potential of polarimetric characteristics from airborne SAR for the evaluation of the seismic vulnerability of structures in urban areas.
References
- Communications Research Laboratory, and National Space Development Agency of Japan (1998). CRL/NASDA Airborne Synthetic Aperture Radar.
- Yamaguchi, Y. (1998), Fundamentals of Polarimetric Radar and its Applications, Realize Inc (in Japanese).
- Van Zyl, J.J., H.A. Zebker, and C. Elachi (1987), Imaging Radar Polarization Signatures: Theory and Observation, Radio Science, 22(4), pp.529-543. Radar illumination direction
- Zebker, H.A., J.J. Van Zyl, and D.N. Held (1987), Imaging Radar Polarimeter from Wave Synthesis, Journal of Geophysical Research, 92(B1), pp.638-701.