| GISdevelopment.net ---> AARS ---> ACRS 1999 ---> Disasters |
A Preliminary Attempt to
Develop An Erosion Risk Map For Langkawi Island, Malaysia Using the USLE,
Remote Sensing and Geographical Information System.
Kamaruzaman Wan Yusof and
Serwan M. J. Baban
GRRU Group, Geography,
School of Natural and Environmental Sciences,
Coventry University, Priory Street, Coventry, CV1 5FB
fax: 44 01203 838447
E-mail: apx158@coventry.ac.uk and S.Baban@coventry.ac.uk
AbstractGRRU Group, Geography,
School of Natural and Environmental Sciences,
Coventry University, Priory Street, Coventry, CV1 5FB
fax: 44 01203 838447
E-mail: apx158@coventry.ac.uk and S.Baban@coventry.ac.uk
A soil erosion risk map was developed for Langkawi Island, Malaysia using the Universal Soil Loss Equation (USLE), remote sensing and GIS. Spatially modelling soil erosion in the GIS required generating representative raster layers based on secondary data for the following parameters; rainfall erosivity, slope length/gradient, soil erodibility and conservation practices. A Landsat TM imagery dated March 1995 was utilised to produce a land use/cover map of the Island based on the Maximum Likelihood Classification method. This map was then, used to generate the conservation practice factor in the USLE. The analysis was performed using IDRISI, a raster based GIS software. Upon comparison, the produced erosion map showed significant similarities with an erosion risk map of the Island produced by conventional means in 1995. The majority of high erosion risk areas seem to be confined to the highlands. This study demonstrates the effectiveness of remote sensing and GIS in generating soil risk maps. The produced erosion risk map is a valuable resource for planners to minimise soil erosion problems caused by future and ongoing development projects on the Island.
Introduction
Land degradation has always been associated with the failure to identify areas that are prone to soil erosion. Moreover, land surveying using conventional method is expensive and time consuming. In contrast, mapping soil erosion using the integration of remote sensing and GIS could identify areas that are at potential risk of extensive soil erosion, provide information on the estimated value of soil loss at various locations. In addition it can provide answers to spatial queries; for instance whether the erosion is associated with specific factors such as the loss of continuos vegetation cover (Kertesz, 1993). This information is very useful in the decision making context to avoid land acquisition in the erosion risk areas or alternatively to recommend soil conservation measures to reduce soil loss if developments were to continue. The Universal Soil Loss Equation (USLE), developed by Wischmeier and Smith (1978), has been used within a Geographical Information System (GIS) frame work to calculate the total erosion loss. The spatially distributed parameters involved in the equation such as topography and land use, could be generated by remote sensing techniques (Moore and Wilson, 1992). These can then be converted into raster layers to input into a GIS to be analysed and, to produce a soil erosion risk map (Lal et. al., 1990; Perez et. al., 1993). In Malaysia, several soil erosion studies have been conducted using this approach. These include the soil erosion study of the Bakun Dam project (Samad and Abdul Patah, 1997) and soil erosion risk assessment for Genting Highlands (Jusoff and Chew, 1998). This study aims to develop and evaluate a preliminary soil erosion risk map for the Langkawi Island, Malaysia using the USLE, remote sensing and GIS.
The study area
Langkawi Island is located west of Peninsular Malaysia between longitude 6°10’ to 6°33’ and latitude 99°35’ to 100°0’(Fig.1). It has an area of 362 sq. kilometres. Langkawi Island is mainly covered by forest, mangroves, shrub, agricultural land, sand beaches and newly expanding developed urban areas. The topography varies from flat coastal plains, hilly areas to rugged mountains. Langkawi Island was selected for this study due to the rapid physical development in the Island since its declaration as a duty free port in 1987. This development has changed the existing land use/cover tremendously and without proper planning and management land degradation will inevitably occur.
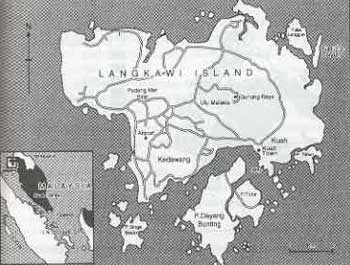
Fig. 1 Study area
Methodology
Generating raster layers for USLE parameters from secondary data.
The USLE expresses the rate of soil erosion as soil loss (Wischmeier and Smith, 1978) and can be written as:
A = R*K*L*S*C*P (1)
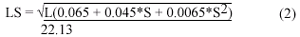
Where A is the computed annual soil loss (kg m- 2 year- 1), R is rainfall erosivity factor (dimensionless), K is soil erodibility factor (dimensionless), L is slope length factor (dimensionless), S is slope steepness factor (dimensionless), C is cropping and management factor (dimensionless), P is conservation practices factor (dimensionless).
In this study, R factor was derived from the mean annual rainfall data collected from different rainfall stations in the Island (Shaaban and Sahat, 1995), K values were estimated from the digitised soil map of a 1984 semi-detailed soil map of Langkawi of scale 1:100 000. This was then rasterised and converted into a K value map by reclassing each soil polygon into its corresponding K value according to Morgan (1986). The soil K erodibility value was determined using a small portable rainfall simulator (Sulaiman et. al., 1995). LS values were computed from equation (2) (Morgan, 1986) :
where, L is slope length in m and S is slope steepness in percent (%).
A Digital Elevation Map (DEM) for Langkawi Island scale 1: 100 000 developed by Taher (1996) was utilized to produce the LS factor. A series of maps OVERLAYING and SCALAR operation in IDRISI for slope length (L) and slope steepness (S) were performed on the DEM to produce the LS map. The C factor is defined as the ratio of soil loss from cropped land which reflects the combined influences of vegetation cover, crop types, tillage and management techniques. C values were obtained from Morgan (1986). P factor takes into account the effectiveness of erosion control practices, such as contouring, terracing and strip-cropping (Jusoff and Chew, 1998).
Producing land use/cover map using remote sensing
A Landsat Thematic Mapper (TM) image with a spatial resolution of 30m for Langkawi Island taken in March 1995 was used to produce a land use/cover map. The image was geometrically and atmospherically corrected. A stratified supervised classification using Maximum Likelihood Method and ground referenced data was carried out to generate the land use/ cover map for the Island (Fig.2). This map layer was converted to the C factor layer in USLE through reclassification of each cover type into its corresponding C value according to Morgan (1986).
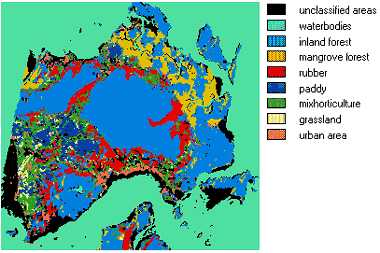
Fig. 2 Land use/cover map of the Langkawi Island (after Baban and Kamaruzaman, 1999)
Developing an Erosion risk map for Langkawi Island
Assuming the worst case scenario, i.e. having bare land with no conservation measures applied. The C and P value in the USLE were taken as 1.0. Using the IDRISI function OVERLAY, each thematic layer of the USLE was overlaid over the respective map layers. The output map shows the distribution of soil erosion assessment for the entire Island (Fig. 3)
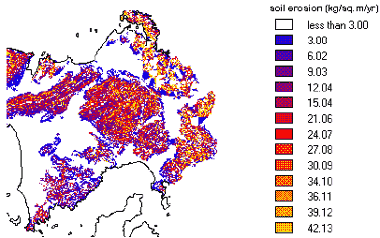
Fig. 3 The spatial distribution of soil erosion category on the Langkawi Island
The map was then classified into 3 erosion risk classes. These are: less than 5 kg/m2 /yr as low, 5 to 15 kg/m2 /yr as moderate and above 15 kg/m2 /yr as high. The outcome represents a potential erosion risk map with the resolution of 30 m per pixel of Langkawi Island (Fig. 4).
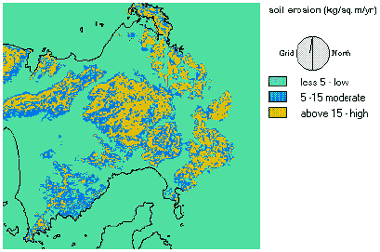
Fig. 4. A potential erosion risk map for the Langkawi Island based on a worst case scenario
Evaluating the Erosion risk map
The produced erosion risk map (Fig.4), was assessed for accuracy by direct comparison of classes, based on geographical location with a friction map of the Langkawi Island, with resolution of 1.7 km2 per pixel, produced from fieldwork in 1995 (Sulaiman et. al. 1996). A total of 95 samples were located on both maps. The overall accuracy achieved was 74%. Individual class accuracy ranged from 62% for high, 72% for moderate and 75% for low erosion risk (Table 1). These figures have to be approached cautiously due to the variation in the spatial resolution between the maps. Nevertheless, they can act as general indicators for the correspondence between a map generated based on field work and Fig 4.
Table 1
|
| ||||||
| remotely sensed data | class1 | class 2 | class 3 | total pixels | % accuracy | |
|
| ||||||
| ground surveyed data | ||||||
| class 1 (low erosion rate) | 45 | 5 | 8 | 58 | 78 | |
| class 2 (moderate erosion rate) | 1 | 12 | 3 | 16 | 75 | |
| class 3 (high erosion rate) | 0 | 8 | 13 | 21 | 62 | |
| total | 95 | |||||
|
| ||||||
overall accuracy is (70/95)*100 =74%
It is evident from the topography map (Fig.2) and the erosion risk map (Fig. 4) that high and moderate erosion risk areas are concentrated mainly in the highlands, that is in the central, eastern and northwest region of the Island. Whereas the low erosion risk are in the lowland areas of western and northeast region. This shows that the slope length and steepness of the highlands have influenced greatly the slope length and steepness factor (LS) in the USLE for the erosion study (Morgan, 1986). It is quite difficult to label the class for moderate and high erosion risk in certain part of the Island (Fig. 4) due to the mixed class pixels due to the variation in the pixel size between the maps. Based on visual interpretation, the class with dominant area covered was assigned. This leads to the error in the overall accuracy.
Conclusion
An erosion risk map for the Langkawi lsland was produced using the USLE, remote sensing and GIS. This map was quantitatively compared to a friction map of the Island produced based fieldwork data in 1995. The overall correspondence was 74%, whilst individual class similarities were 62% , 72% and 75% for high, moderate and low erosion risk classes respectively. Major factors influencing soil erosion in Langkawi Island were the slope length (L) and slope steepness (S). Thus, most of the Langkawi Island highland areas are potentially subject to very high predicted soil losses. This study demonstrates the effectiveness remote sensing and GIS in generating essential quantitative information on soil erosion. The outcome for this type of studies represents a valuable resource for decision makers to guard against land acquisition in high erosion risk areas or to issue conditional permits with conservation measures to future development projects in moderate erosion risk areas on the Langkawi Island.
References
- Baban S. M. J., and Kamaruzaman W.Y. 1999. Mapping land use/cover distribution in a Mountainous Tropical Island using remote sensing and GIS. International Journal of Remote Sensing (in submission).
- Baharuddin, M. K. and McGuire, G., 1996. Erodibility of Soil and Erosion Risk Map. In Seminar Kajian Hidrologi Pulau Kecil - Pulau Langkawi. Organised by the Department of Irrigation and Drainage, Malaysia. Section I, paper 3.
- Jusoff, K and Chew, S., 1998. Soil Erosion Risk Assessment Using Satellite Data In Genting Highland . In International Symposium Of Arid Region Soil. Izmir, Turkey.
- Kertesz, A., 1993. Application of GIS Methods in Soil Erosion Modellling. Computer Environment and Urban Systems, 17, 233-238.
- Lal, H., Jones, J. W., and Beinroth, F. H., 1990. Regional Agricultural Planning Information and Decision Support System. In Proc. on Application of Geographic Information Systems, Simulation Models, and Knowledge-based Systems for Landuse Management, Virgina Polytechnic Institute and State Uneversity, Blacksburg, 51-60.
- Moore I. D., and Wilson, J. P., 1992. Length-Slope Factors for the Revised Universal Soil Loss Equation: Simplified Method or Estimation. Journal of Soil and Water Conservation, 45(5), 423-428. Morgan, R. P. C., 1986. Soil Erosion And Conservation. Longman Scientific And Technical, England. 298p
- Perez, L. R., Beinroth, F. H., and Jones, J. W., 1993. AEGIS: Agricultural and Environment Geographical Information System. In Proc. 32d Caribbean Food Crop Society, Santo Domingo.
- Samad R., and Abdul Patah, N., 1997. Soil Erosion and Hydrological Study of the Bakun Dam Catchment Area, Sarawak Using Remote Sensing and Geographical Information System (GIS). In Proc. 18th Asian Conference on Remote Sensing, Kuala Lumpur, Malaysia, B-5-1 to B-5-6.
- Shaaban A. J., and Sahat, R., 1996. Hydrological Characteristics and Surface Water Availability of Pulau Langkawi. In Seminar Kajian Hidrologi Pulau Kecil - Pulau Langkawi. Organised by the Department of Irrigation and Drainage, Malaysia. Section 1, paper 1.
- Sulaiman, W. N. A., Yusoff, M. K., Ghazali, A. W., 1996. An Analysis of Soil Erodibility Distribution of Langkawi Island. In Seminar Kajian Hidrologi Pulau Kecil - Pulau Langkawi. Organised by the Department of Irrigation and Drainage, Malaysia. Section 2, paper 6
- Taher, B., 1996. Developing an Environmental GIS Database for Pulau Langkawi. In Seminar Kajian Hidrologi Pulau Kecil- Pulau Langkawi, Section 4, paper 8.
- Wischmeier, W. H. and Smith, D. D., 1978. Predicting Rainfall Erosion Losses - A Guide To Conservation Planning. USDA-SEA Agriculture Handbook 537. U.S Department Of Agriculture, 1-22