| GISdevelopment.net ---> AARS ---> ACRS 1999 ---> Disasters |
An Operational Satellite Dust
Storm Monitoring System
Lu Wenjie, Zhen Xinjiang,
Sun Sinheng, Zeng Xiaomei, Sun Siheng
National Satellite Meteorological Center, Beijing 100081
1.
Classification of weather Patterns On Cloud Maps National Satellite Meteorological Center, Beijing 100081
A server dust storm is defined as: the strong-convection dusts storm weather with a wind speed of >20 m/s Km and a visibility of <200 m. Different from a common dust storm with a visibility of <1.0 km, a server dust storm may result in disaster in the area on its track. According to the analysis of 20 severe dust storms from 1977 to 1998, severe dust storms can be divided into two categories: dust storms before and behind a cold front.
1.1 The image characteristics of pre-front dust storms
In case of pre-front dust storms, there is usually a cold front cloud band stretching from northeast to southeast with a clear-cut the back boundary and several small convection cells developing from a front boundary. Then, the convection cells further develop into a squall line and invoke a severe dust storm. The cold front behind further intensifies the dust storms. The dust storms occurred in 5 May 1993 is an example (Fig. 1).
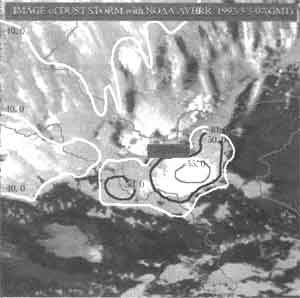
Figure 1: The dust storm in Jinchang monitored by NOAA/AVHRR in May 5,1993
Figure 1 is a NOAA-II three channel composite map. The satellite passed through Jinchang at 16:00, Jinchang is situated behind a mesoscale cloud cluster (A); a cloud band (B) corresponding the surface front is located in the northeast and the dark area (C) between cloud cluster and front cloud band is a part of the dust storm area observed by the satellite. At the moment, the cloud front had not yet arrived at Jinchang, and the severe dust storm had passed about 20 min. therefore, it can be said that the severe dust storm was caused by the mesoscale the cloud cluster, whose top temperature was as low as -550C. The cloud cluster combine with the convective cloud band into a squall line arrived at system. Before the squall line arrived at Wuwei (D) the surface temperature is relatively high (red); surface objects are very distinctive; and weather is clear and fine.
1.2 The image characteristics of post-front dust storms
The most common dust storms in China are those caused by the strong wind behind a cold front after the cold front passing through. On cloud maps, these cold front cloud bands can divide into two kinds: wide and narrow clouds bands. Cold fronts related to the wider cold clouds tend to bring about severer dust storms (Figure omitted).
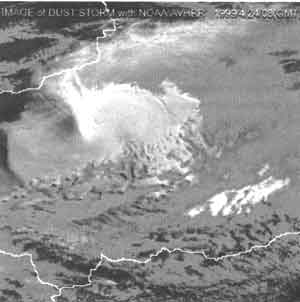
Figure 2: The dust storm in southern Sinjiang monitored by NOAA/AVHRR in April 5,1999
2. Computation of Dust Content
Based on the atmospheric radiation transfer theory, in conjunction with NOAA/AVHRR remote sensing data, the reflectance of a dust storm over the inland arid region of the northwestern China is calculated and the optical depth of dust aerosol is derived, thus obtaining the dust content of the dust storm.
The reflectance of radiation received in the satellite instantaneous view field can be written as[1]:
Where R (ms, mv, fv) is the reflectance at the satellite level; ms, mv express respectively solar and satellite zenith angle; fv is satellite azimuth; (U03) and (UH20) are diffusion transmissivities of O3 and Vapor respectively; Ra.m and Ra,a are atmospheric molecular and aerosol reflectance respectively; Rg and Re are the effect of remote sensing environment on satellite view field and surface reflectance respectively; As is atmospheric spherical albedo; T(ms) and T(mv) are the total transmissivities of dust aerosol along the sun-surface-satellite paths respectively. The effects of O3 and H2O absorption in NOAA-AVHRR Ch1 (0.58-0.68 mm) as well as atmospheric molecular reflectance need to be determined.
The content of large particles (r>1mm, r is the radius of a dust particle) increases rapidly with the increasing intensity of fly dust and dust storm. The scattering and extinction characteristics of large particles, especially the particles with a radius of > 10 mm, play the major role. Given that dust aerosol layer is a plane parallel layer, the scattered light is natural unpolarized light and dust particles have the spherical shape, the phase function is expressed as: [2]
Where g1 and g2 are the asymmetry factors calculated from Mie scattering theory (r=10 mm) , indicate forward and backward scattering, b is weighted coefficient. Based on Mie scattering theory, the brightness temperatures of AVHRR Ch3 and Ch4 and the absorbing coefficient of particle when r=10 mm, the multiple scattering of incident photon in the dust layer is compared so as to calculate pixel by pixel the reflectance and absorptance of dust aerosol by using Monte-Carlo method. Use the corresponding surface image under clear sky during the time period of dust storm frequently occurring and carry out atmospheric correction and simplification of (1). From (1) and dust reflectance, as well as the approximate equations of atmospheric transmissivity and reflectance coefficients:[3]
Then t, the optical depth of a dust layer, can be obtained. In (3) and (4), R (t, m) is the boundary condition parameter are the first order scattering transmissivity and reflectance of spherical particles, xi is the parameter concerning the characteristics of particles. The resulting optical thickness of the dust storm in Kashi, Xinjiang Aut. Reg. In April 24, 1999 is about 2.0-5.0 (Fig 3).
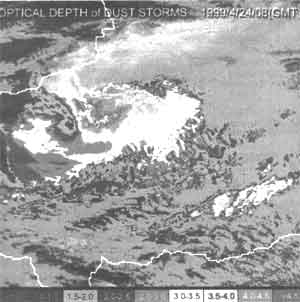
Figure 3: The optical thickness over the southern Xinjiang Aut. Reg. in April 24. 1999
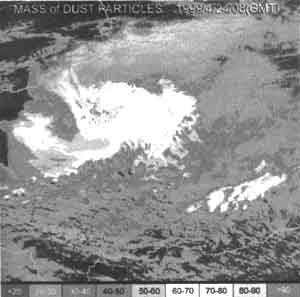
Figure 4: The dust mass loading over the southern Xinjiang Aut. Reg. in April 24, 1999
Using Junge's spectrum distribution model n (r)= Cr(v+1), is the total mass of particles in the vertical column is [4].
According to (5) , the total mass of dust particles can be obtained pixel by pixel. The resulting dust content is 20-90 t/km2.
3. The Operational System of Disaster Assessment
The disaster assessment system is mainly based on a database containing such comprehensive factors as the on-the-spot investigation of farmland, grassland and forests, the distributions of population and urban areas, environmental factors, etc., in conjunction with certain common geographical information system (regionalization, rivers , railway, highway, etc.,). Using GIS software to process above mentioned data, the system can produce a detailed disaster situation assessment report according to the data on the extent of the areas suffered from dust storms provided by a monitoring system.
References
- Tanre D et. al. Atmospheric correction algorithm for NOAA-AVHRR products: theory and application IEEE Tran Geosci Remote Sensing, 1992, 30(2).
- Goody.R.M. et. al., Atmospheric Radiation Theoretical Basis. New York Oxford University Press, 1989.
- Sobolev V V et. al. A Treatise on Radiative transfer. D. VAN Nostrand Company, ING. 1963.
- Cachorro V E et. al. The correlation between particle mass loading and extinction application to desert dust aerosol content estimation. Remote Sensing environment, 1997, 60(2).
Fig. 5 The overall design for the meteorological satellite system of dust storms monitoring and the operational system of disaster assessment.
Fig.6 Short range duststorm forecasting system working flow chart and offering function.