| GISdevelopment.net ---> AARS ---> ACRS 1999 ---> Disasters |
Attempt for Automated
Detection of Damaged Buildings Using Aerial HDTV Images
Hirotada Hasegawa, Hisashi
Aoki and Fumio Yamazaki
Earthquake Disaster Mitigation Research Center, Riken
24645-1 Mikiyama, Miki , Hyogo 673-0433 , Japan
Tel: +81-794-83-6632 Fax : +81-794-83-6695
E-mail: hasegawa@miki.riken.go.jp
And
Izumi Sekimoto
Japan Broadcasting Corporation ( NHK)
2-2-1 Jinnan, Shibuya-Ku, Tokyo 150-8001, Japan
Phone : + 81-3-5478-2758 Fax : +81-3-3465-6910
Keyword:
Aerial HDTB Images, Image Processing, Building Damage, 1995 Kobe
Earthquake. Earthquake Disaster Mitigation Research Center, Riken
24645-1 Mikiyama, Miki , Hyogo 673-0433 , Japan
Tel: +81-794-83-6632 Fax : +81-794-83-6695
E-mail: hasegawa@miki.riken.go.jp
And
Izumi Sekimoto
Japan Broadcasting Corporation ( NHK)
2-2-1 Jinnan, Shibuya-Ku, Tokyo 150-8001, Japan
Phone : + 81-3-5478-2758 Fax : +81-3-3465-6910
Abstract:
The characteristics of aerial high -definition television ( HDTV) images of damaged building due to he 1995 Hyogoken-Nanbu ( Kobe ) earthquake were examined in order to evaluate the possibility of automatic detection of damaged buildings . In this study , the relationships between the degree of building damage and the color information and edge intensity from aerial images were examined by image processing, and were used for the automated detection of damaged buildings. Our automated interpretation results from aerial HDTV images were in fairly good agreement with those of ground surveys, although the extraction accuracy was not particularly high.
1. Introduction
Several methods for gathering information on damage due to natural disasters are available, such as field surveys, aerial television imagery , aerial photography and satellite imagery. Aerial television images by means of which each and every building in a large area can be easily and quickly monitored, may provide effective information during athe early stage of recovery activity. The authors have already reported preliminary studies on the possibility of visually identifying earthquake damage using aerial high-definition television ( HDTV) images ( Hasegawa et al., 1999, 2000) ) . however, it is difficult to interpret the building damage in a large area in a short time. Therefore, the difficult to interpret the building damage in a large in a short time. Therefore, the automated detection of damaged buildings is requisite. Characteristics of severely damaged wooden buildings were examined using image processing of aerial HDTV images taken after the Kobe earthquake. The detection of damaged areas was performed by comparing satellite images taken pre-and post-earthquake ( Matsoka and Yamazak, 1998; Aoki et al., 1998). However, the detection of damaged building s by comparing pre-and post-earthquake aerial images is impractical, because it is difficult to obtain pre-earthquake aerial images. In this study, we only used aerial television images taken after event. Characteristics of damaged building were examined form aerial images for automated detection of the distributions of these buildings. Damaged buildings were identified by extracting the edge elements present only in the aerial HDTV images of collapsed buildings based on color and edge information. The results of automated detection of damaged buildings were compared with the visually interpreted results.
2. Aerial Television Images And The Studied Area
Arial imaging of areas damaged due to the kobe earthquake was started shortly after the event by the Japan . Broadcasting Corporation ( NHK). In this study, we used some of these images taken 10 days after the event. These images were taken at a 30-45 degree angle from the vertical direction, from a height of about 300m by NHK's HDTV cameras. The HDTV images were converted to RGB image data prior to use. The region of this image and this studied are shown in Figure 1 and 2. the spatial resolution of this image is approximately 9 and 17 cm for near and far distance from the camera, respectively.
The areas covered in this study include several blocks ( about 200m x 230m and 46000m2 ) in Nishinomiya City. In this area, many wooden buildings suffered severe damage due to the earthquake.
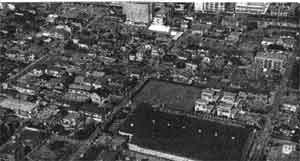
Figure 1 Aerial HDTV image
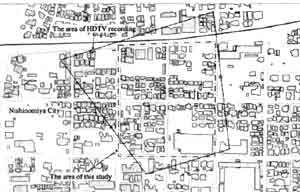
Figfue 2 The area of HDTV recording
3. Data of Visual Extraction of Damaged Buildings
The damaged buildings in the studied area were already extracted visually using aerial HDTV images ( Hesegawa et al., 1999), in the visual extraction, the buildings damage level was classified into three categories; collapsed, damaged and nondamaged buildings. Outlines of nondamaged buildings were distinctly observed in the images and the form of buildings was confirmed. As for the collapsed buildings, the soil under the roofing tile and the roofing tile were mixed in the images. Hence, images characteristics of the area representing collapsed buildings were examined using color information and edge elements, in this study.
4. Quantification of Image Characteristics of Damaged Buildings
The area representing collapsed and nondamaged building were selected by visual extraction from the aerial HDTV images. In addition, a ground area was selected. The characteristics of selected buildings are shown in Table 1, and selected pixels from aerial HDTV images are shown in Figure 3. The number of pixels fro each object extracted from the aerial HDTV image was different, because they were selected based on the area of each building had already been covered with blue vinyl canvas sheets as the images were taken 10 days after the earthquake. This characteristic ( blue vinyl canvas sheet ) of damaged buildings was not used in this study.
Edge elements for collapsed buildings ( C-1, 2,3), nondamaged buildings (N-1, 2, 30 and bare ground (G-1) were detected. The intensities of edge elements were calculated by a general gradient filter with a 3x3 pixel window and were allocated a 1 byte value. The relationship between the edge intensity value and the cumulative percentage of relative frequency is shown in figure 4. on observing he data for nondamaged building 9 N-1) and ground ( G_1), it is found that their edge intensity values are almost all distributed in the range of 0-32. for collapsed buildings ( C-1, 2,3 ), it is found that the intensity values are almost all ( 95%) distributed in the range of 0-90.
| Area no. | Degree of building damage | Number of pixels | Remarks |
| C-1 | Collapse (rubble) | 2758 | A wooden building |
| C -2 | Collapse (rubble ) | 7951 | A wooden building |
| C -3 | Collapse (rubble ) | 15321 | A wooden building |
| N-1 | No damage | 10000 | The roof of a gymnasium with dark green color |
| N-2 | No damage | 14695 | The roof and wall of a wooden building with white color |
| N-3 | No damage | 7649 | A building of complicated shape with brown roofs. |
| G-1 | Ground | 5400 | A bare ground |
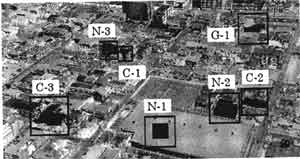
Figure 3 The selected buildings and areas
Figure 4 Relationship between edge intensity value and cumulative percentage of relative frequency
Figure 5 Relationship between variance value of edge intensity and cumulative percentage of relative frequency
Color information and variances of edge intensity were analyzed from images of selected area, because the edges of middle intensity (32-90) existed in not only collapsed buildings but also in nondamaged buildings. Variances in the edge intensity were examined for the are of 7x7 pixels and were allocated a 1 byte value. The relationship between the variance value of edge intensity and the cumulative percentage of relative frequency is shown in Figure 5. for the collapsed buildings ( C-1,2,3), it is found that the variance values of edge intensity are almost all (90%) distributed in the range of 0-15.
(a) Distribution of relative frequency of hue for the selected buildings
(b) Distribution of relative frequency of intensity for the selected buildings
(c) Distribution of relative frequency of saturation for the selected buildings
Figure 6 Characteristics of color information for selected buildings
Figure 7 Edge detection for the selected areas
Color information such as hue, brightness and saturation as calculated using the RGB values for selected areas, and the relative frequencies of each area were calculated as shown in Figure 6. the relative frequencies of the hue of collapsed buildings are distributed in the range of 127.5-167.5 degrees ( this color range is from red to yellow ) . these values are justified by the fact that the soil under the roofing of the collapsed buildings could be observed. As for brightness and saturation, a difference was not confirmed between the values for collapsed buildings and for nondamaged buildings.
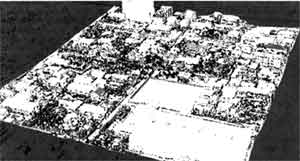
Figure 8 Distribution of damaged buildings extracted by image processing
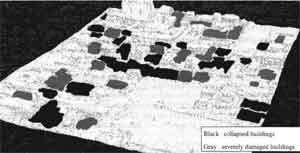
Figure 9 Distribution of severely damaged buildings based on ground surveys (AIJ and CPIJ, 1995; BRI, 1996) and collapsed buildings based on visual extraction from aerial HDTV images
5. Extraction of Damaged Buildings Distribution by Image Processing
The edge elements which existed only in the area of collapsed buildings were extracted using conditions such as the edge intensity value in the range of 32-90, the variance values of edge intensity in the range of 0-15 and the hue value in the range of 127.5-167. the edge elements extracted by this procedure for the selected areas of collapse buildings. The damaged buildings distribution in this studied area was extracted using this procedure and is shown in Figure 8. also, severely damaged buildings based on ground surveys, and collapsed buildings based on visual extraction from aerial HDTV images, are shown in Figure 9. the extracted damage distribution data from aerial HDTV images agreed with damage survey results.
6.Conclusions
Image characteristics of damaged buildings were examined using image processing of aerial HDTV images taken after the 1995 Kobe earthquake. Furthermore, the distribution of damaged buildings was extracted on the basis of these characteristics. Characteristics of the damage to wooden buildings were defined on the basis if hue, edge intensity and edge intensity variance and by using the threshold value of these parameters. As for the detection of damaged-building distribution by using these characteristics, although the extraction accuracy was not particularly high, many edges extracted from the images of collapsed buildings and part of the severely damaged buildings.
Acknowledgment
The ground survey data used in this study were provided by the Architectural institute of Japan, the city planning Institute of Japan , and the Building Research Institute.
References
- Aoki, H., Matsuoka, M. and Yamazaki, F. (1998). Characteristics of satellite SAR images in the damaged area due to the hyogoken-nanbu earthquake, 19th Asian conf. Of remote sensing , pp.C7/1-6.
- Architectural institute of Japan and city planning Institute of Japan, (1995). Report of emergency damaged survey of the 1995 Hyogoken -Nanbu Earthquake.
- Building Research Institute, (1996). Final report of damage survey of the 1995 Hyogoken-Nanbu Earthquake ( in Japanese )
- Hasegawa, h., Yamazaki, F., Matsuoka, M., and Sekimoto, I. (1999). Extraction of Building Damage due to the 1995 Hyogoken-Nanbu Earthquake from Aerial HDTV Images, Processing of Asian-Pacific Symposium on structural Reliability and its Application NCREE, pp. 280-288.
- Hasegawa, h., Yamazaki, F., Matsuoka, M., and Sekimoto, I. (2000). Extraction of Building Damage due to earthquake using aerial television images, Proceedings of 12the world Conference on Earthquake engineering ( in press )
- Matsuoka, M. and Yamazaki, F. (1998). Identification of Damaged Areas due to the 1995 Hyogoken -Nanbu Earthquake using Satellite Optical Images, 19th Asian Conf. of Remote sensing, pp. Q9/1-6.