| GISdevelopment.net ---> AARS ---> ACRS 1999 ---> Airborne Remote Sensing |
Applicability of AIRSAR Data
Sets to Hazard Mapping of Canlaon Volcano, Philippines
Rowena B. Quiambao , Ronnie
C. Torres, Mylene Martinez-Villegas, Ma. Antonia Bornas, Benedict Sikat,
Maria Isabel Abigania
Philippine Institute of Volcanology and Seismology
Department of Science and Technology
C.P. Garcia Street, University of the Philippines, Diliman, Quezon City,
Philippines 1101
Telephone: (632) 426 14 68 to 79 Fax: (632) 920 70 58
E-Mail:weng@phivolcs.dost.gov.ph
Philippine Institute of Volcanology and Seismology
Department of Science and Technology
C.P. Garcia Street, University of the Philippines, Diliman, Quezon City,
Philippines 1101
Telephone: (632) 426 14 68 to 79 Fax: (632) 920 70 58
E-Mail:weng@phivolcs.dost.gov.ph
Keywords:hazards, volcanic, mapping,
classification, AIRSAR
Abstract
Canlaon Volcano, a strato-volcano situated in the Negros Island, Central Visayas, (10°24.7', 123°7.9'E), is one of the six most active volcanoes in the Philippines. The Philippine Institute of Volcanology and Seismology (PHIVOLCS) monitors the volcano and maintains three observatories in the area. In anticipation of volcanic eruptions, the Institute prepares hazard maps of the volcano. These hazard maps are necessary tools for hazard mitigation and disaster-preparedness plans of the government.
Airborne Synthetic Aperture Radar (AIRSAR) images covering part of the Canlaon Volcano area are continuously being processed towards becoming a possible tool to augment hazard map generation. The polarimetric (POLSAR) and topographic (TOPSAR) data sets of the images were processed using the software ENVI (Environment for Visualizing Images). The basic geometric and radiometric corrections were first applied to the images. To generate a better surface detail of the area, image enhancements were done using the band mathematics calculation module of the ENVI software. The polarimetric data set (C-VV, and all the polarization of the L- and P-bands) was combined into one file. This was classified using the maximum likelihood option to generate a classification map. The digital elevation model for the C-band (topographic data set) was used to map out the volcanic deposits in the area. The resultant products from processing the POLSAR and TOPSAR data sets are being used as additional tool to the hazard map generation of Canlaon Volcano.
This paper summarizes the image processing done to the AIRSAR images of Canlaon Volcano as applied to hazard mapping activity. The output products from the image processing activities are image maps of the Canlaon Volcano area containing the distribution of volcanic products spread around the study area. Details of the image processing of the AIRSAR images are presented and discussed. The paper identifies and highlights the potential of the AIRSAR data sets as applied to geologic and hazard mapping activity on a volcano.
I. Introduction
A. Canlaon Volcano
Canlaon Volcano, a strato-volcano, is situated in the north central portion of Negros Island, Philippines, with the geographic location of 10º 24.7´N and 123º 7.9´E and peak elevation from sea level of 2,465 meters (Figure 1, Location Map of Canlaon Volcano). The Philippine Institute of Volcanology and Seismology (PHIVOLCS) maintains three Volcano Observatory Stations around and within the vicinity of Canlaon Volcano.
Figure 1. Location Map of Canlaon Volcano
Despite its being listed as one of six most active volcanoes in the Philippines, Canlaon Volcano has had no violent eruption ever recorded yet. Normal ash explosions and steam blast, as in its first known eruption in 1866, characterized majority of its eruptions. It has similar phreatic eruption in 1893, 1894, and in 1898. In 1902 and 1906, Canlaon Volcano is said to have erupted again characterized by lava outpouring. The 1969 eruption of Canlaon Volcano saw tephra falls with blocks hurling to a distance of around 3 kilometers from the crater. The same type of volcanic debris was seen in the 1978 eruption as well as some more ash ejection. Earthquake swarms occurred in the volcano area in 1973 and in 1980 but for both instances, these did not culminate into an eruption. In 1987 and 1988, small ash and steam ejection were again observed. The most recent eruptive activity of Canlaon Volcano in 1996 was generally characterized by ash ejection as well.
A semi-detailed geologic mapping and preliminary hazard assessment was done on Canlaon Volcano (Umbal and Arboleda, 1987). More detailed geologic mapping was started in 1998 with the purpose of establishing a detailed volcano stratigraphy and revising the existing map. A review and interpretation of topographic maps and aerial photos of the area were undertaken. The preliminary map produced was subsequently verified in the surveys conducted in 1998 and 1999. The output geologic map will become the basis in delineating and/or updating the existing hazard maps of Canlaon Volcano.
The entire geographic coverage of the study area covers the following latitude-longitude extent based on 1:50,000 topographic base map:
B. AIRSAR Images and ENVI
There are three AIRSAR image strips taken in 1996 that comprise the aerial flight in the Canlaon area (Kanlaon_102-1A, Kanlaon_202-1A, and Kanlaon _102-2A). Within the study area for Canlaon Volcano, the three strips comprise the following latitude-longitude extent based on the header files of the images:
This paper discusses the image processing applied to the AIRSAR (Airborne Synthetic Aperture Radar) data sets of Canlaon Volcano using the software ENVI (Environment for Visualizing Images). Image enhancements, corrections, creation of relief maps from the Digital Elevation Models, band ratio analysis, principal component analysis and supervised classification are the processing techniques applied to the AIRSAR images in order to generate map images that can be used to aid hazard mapping. It is emphasized that the processing done to a part of the entire set of images covering the Canlaon area will be towards the development of a procedure to be implemented later. It is envisioned that the utilization of the AIRSAR data sets will be maximized as applied to volcanic hazards mapping.
II. Image Processing
The L- and P-band files of the three image strips have been synthesized, and together with the C-VV file for each, has been inspected visually. Hard copies of these raw files were printed. A virtual mosaic of the three image strips was made and a print out was used to map out volcanic deposit products much like the photo-geologic mapping technique out of aerial photographs.
Actual processing of the images started with the uppermost or northernmost strip going down to the southern strip. The C-band (vertical-vertical polarization) was subjected to the following procedures:
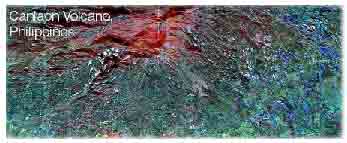
Figure 2. RGB Image Map of P-HV, L-HH and L-HV Bands
The Digital Elevation Model (DEM) of the AIRSAR images were converted to physical parameters – degree for the slope and meters for the elevation. The DEM file was generated from the C-VV image file. Topographic modeling was then applied generating the shaded relief, slope and aspect bands. The POLSAR images (the combined L-, P-, and C-bands) was then classified using the maximum likelihood classification option. The training areas used for classification were selected by using the printouts of the processed images. In this regard, pure visual identification of the volcanic products as seen on the printouts was used to map out and identify the training areas for classification. To obtain the confusion matrix for the classification, the result of field survey was used to select the exact points/locations of volcanic features in the image. These points/ locations were used as training areas. Comparative analysis of the classification gave an accuracy of up to 87.5969% and kappa coefficient of 0.8408.
Apart from the classification processes, band ratio and principal component techniques were applied to the polarimetric files. Analysis of the resulting image maps from these techniques are being used to refine the result of the image classification. Utilizing the techniques mentioned above, mapping out of volcanic products in the Canlaon Volcano area (geologic map output) was enhanced and aided. The resulting map of the volcanic products using the processed images will then be used as a basis for the additional refinement of already existing geologic map. At the stage of writing this paper, the actual delineation of hazard boundaries for Canlaon Volcano has not yet commenced. Aside from the geologic map to be refined through the use of the mages, the actual hazard mapping will be further enhanced through the use of the derivative maps from the AIRSAR images – slope, shaded relief and aspect maps; image contouring of the DEM files and draping of the polarimetric files over the elevation data.
III. Conclusion
Several image processing techniques could be applied to AIRSAR (TOPSAR and POLSAR) images in order to generate image map outputs which could be utilized to aid the hazard mapping of Canlaon Volcano
Image processing for the image strips of Canlaon Volcano was done separately – for the POLSAR files (C-VV and for the L-&P-band) and the TOPSAR files (C-DEM band). Image enhancements for the C-VV file involved the sigma zero-band math-and-lee filter procedures. Geometric correction applied to all the files was the slant-to-ground range correction.
Slope, aspect, and shaded relief maps were modeled from the C-DEM files. Maximum likelihood classification was done to the polarimetric files. Ground verified locations in the study area produced an accuracy of up to 87.5969% and kappa coefficient of 0.8408 as compared with the classified image.
Analysis from image map outputs, when combined with other available data, can provide a substantial basis in the delineation of volcanic hazards of Canlaon Volcano. Final hazard mapping is to be supported by the derivative products of the AIRSAR images as well as the processing modules of the ENVI software.
Abstract
Canlaon Volcano, a strato-volcano situated in the Negros Island, Central Visayas, (10°24.7', 123°7.9'E), is one of the six most active volcanoes in the Philippines. The Philippine Institute of Volcanology and Seismology (PHIVOLCS) monitors the volcano and maintains three observatories in the area. In anticipation of volcanic eruptions, the Institute prepares hazard maps of the volcano. These hazard maps are necessary tools for hazard mitigation and disaster-preparedness plans of the government.
Airborne Synthetic Aperture Radar (AIRSAR) images covering part of the Canlaon Volcano area are continuously being processed towards becoming a possible tool to augment hazard map generation. The polarimetric (POLSAR) and topographic (TOPSAR) data sets of the images were processed using the software ENVI (Environment for Visualizing Images). The basic geometric and radiometric corrections were first applied to the images. To generate a better surface detail of the area, image enhancements were done using the band mathematics calculation module of the ENVI software. The polarimetric data set (C-VV, and all the polarization of the L- and P-bands) was combined into one file. This was classified using the maximum likelihood option to generate a classification map. The digital elevation model for the C-band (topographic data set) was used to map out the volcanic deposits in the area. The resultant products from processing the POLSAR and TOPSAR data sets are being used as additional tool to the hazard map generation of Canlaon Volcano.
This paper summarizes the image processing done to the AIRSAR images of Canlaon Volcano as applied to hazard mapping activity. The output products from the image processing activities are image maps of the Canlaon Volcano area containing the distribution of volcanic products spread around the study area. Details of the image processing of the AIRSAR images are presented and discussed. The paper identifies and highlights the potential of the AIRSAR data sets as applied to geologic and hazard mapping activity on a volcano.
I. Introduction
A. Canlaon Volcano
Canlaon Volcano, a strato-volcano, is situated in the north central portion of Negros Island, Philippines, with the geographic location of 10º 24.7´N and 123º 7.9´E and peak elevation from sea level of 2,465 meters (Figure 1, Location Map of Canlaon Volcano). The Philippine Institute of Volcanology and Seismology (PHIVOLCS) maintains three Volcano Observatory Stations around and within the vicinity of Canlaon Volcano.
Figure 1. Location Map of Canlaon Volcano
Despite its being listed as one of six most active volcanoes in the Philippines, Canlaon Volcano has had no violent eruption ever recorded yet. Normal ash explosions and steam blast, as in its first known eruption in 1866, characterized majority of its eruptions. It has similar phreatic eruption in 1893, 1894, and in 1898. In 1902 and 1906, Canlaon Volcano is said to have erupted again characterized by lava outpouring. The 1969 eruption of Canlaon Volcano saw tephra falls with blocks hurling to a distance of around 3 kilometers from the crater. The same type of volcanic debris was seen in the 1978 eruption as well as some more ash ejection. Earthquake swarms occurred in the volcano area in 1973 and in 1980 but for both instances, these did not culminate into an eruption. In 1987 and 1988, small ash and steam ejection were again observed. The most recent eruptive activity of Canlaon Volcano in 1996 was generally characterized by ash ejection as well.
A semi-detailed geologic mapping and preliminary hazard assessment was done on Canlaon Volcano (Umbal and Arboleda, 1987). More detailed geologic mapping was started in 1998 with the purpose of establishing a detailed volcano stratigraphy and revising the existing map. A review and interpretation of topographic maps and aerial photos of the area were undertaken. The preliminary map produced was subsequently verified in the surveys conducted in 1998 and 1999. The output geologic map will become the basis in delineating and/or updating the existing hazard maps of Canlaon Volcano.
The entire geographic coverage of the study area covers the following latitude-longitude extent based on 1:50,000 topographic base map:
| Latitude extent | 10°10´ - 10°40´N |
| Longitude extent | 122°39´ - 123°24´E |
B. AIRSAR Images and ENVI
There are three AIRSAR image strips taken in 1996 that comprise the aerial flight in the Canlaon area (Kanlaon_102-1A, Kanlaon_202-1A, and Kanlaon _102-2A). Within the study area for Canlaon Volcano, the three strips comprise the following latitude-longitude extent based on the header files of the images:
| Latitude extent | 10°10´ - 10°40´N |
| Longitude extent | 122°22´55.2"- 123°43´41.8"E |
This paper discusses the image processing applied to the AIRSAR (Airborne Synthetic Aperture Radar) data sets of Canlaon Volcano using the software ENVI (Environment for Visualizing Images). Image enhancements, corrections, creation of relief maps from the Digital Elevation Models, band ratio analysis, principal component analysis and supervised classification are the processing techniques applied to the AIRSAR images in order to generate map images that can be used to aid hazard mapping. It is emphasized that the processing done to a part of the entire set of images covering the Canlaon area will be towards the development of a procedure to be implemented later. It is envisioned that the utilization of the AIRSAR data sets will be maximized as applied to volcanic hazards mapping.
II. Image Processing
The L- and P-band files of the three image strips have been synthesized, and together with the C-VV file for each, has been inspected visually. Hard copies of these raw files were printed. A virtual mosaic of the three image strips was made and a print out was used to map out volcanic deposit products much like the photo-geologic mapping technique out of aerial photographs.
Actual processing of the images started with the uppermost or northernmost strip going down to the southern strip. The C-band (vertical-vertical polarization) was subjected to the following procedures:
- Conversion from raw intensity to sigma values;
- Conversion from sigma values to decibel values;
- Lee filtering of the decibel file;
- Slant to ground range correction applied to the Lee-filtered file.
Figure 2. RGB Image Map of P-HV, L-HH and L-HV Bands
The Digital Elevation Model (DEM) of the AIRSAR images were converted to physical parameters – degree for the slope and meters for the elevation. The DEM file was generated from the C-VV image file. Topographic modeling was then applied generating the shaded relief, slope and aspect bands. The POLSAR images (the combined L-, P-, and C-bands) was then classified using the maximum likelihood classification option. The training areas used for classification were selected by using the printouts of the processed images. In this regard, pure visual identification of the volcanic products as seen on the printouts was used to map out and identify the training areas for classification. To obtain the confusion matrix for the classification, the result of field survey was used to select the exact points/locations of volcanic features in the image. These points/ locations were used as training areas. Comparative analysis of the classification gave an accuracy of up to 87.5969% and kappa coefficient of 0.8408.
Apart from the classification processes, band ratio and principal component techniques were applied to the polarimetric files. Analysis of the resulting image maps from these techniques are being used to refine the result of the image classification. Utilizing the techniques mentioned above, mapping out of volcanic products in the Canlaon Volcano area (geologic map output) was enhanced and aided. The resulting map of the volcanic products using the processed images will then be used as a basis for the additional refinement of already existing geologic map. At the stage of writing this paper, the actual delineation of hazard boundaries for Canlaon Volcano has not yet commenced. Aside from the geologic map to be refined through the use of the mages, the actual hazard mapping will be further enhanced through the use of the derivative maps from the AIRSAR images – slope, shaded relief and aspect maps; image contouring of the DEM files and draping of the polarimetric files over the elevation data.
III. Conclusion
Several image processing techniques could be applied to AIRSAR (TOPSAR and POLSAR) images in order to generate image map outputs which could be utilized to aid the hazard mapping of Canlaon Volcano
Image processing for the image strips of Canlaon Volcano was done separately – for the POLSAR files (C-VV and for the L-&P-band) and the TOPSAR files (C-DEM band). Image enhancements for the C-VV file involved the sigma zero-band math-and-lee filter procedures. Geometric correction applied to all the files was the slant-to-ground range correction.
Slope, aspect, and shaded relief maps were modeled from the C-DEM files. Maximum likelihood classification was done to the polarimetric files. Ground verified locations in the study area produced an accuracy of up to 87.5969% and kappa coefficient of 0.8408 as compared with the classified image.
Analysis from image map outputs, when combined with other available data, can provide a substantial basis in the delineation of volcanic hazards of Canlaon Volcano. Final hazard mapping is to be supported by the derivative products of the AIRSAR images as well as the processing modules of the ENVI software.