| GISdevelopment.net ---> AARS ---> ACRS 1999 ---> Airborne Remote Sensing |
Development of the Technology
of Making a DEM Using Airborne Synthetic Aperture Radar (SAR)
Takaki Okatani, Mamoru
Korarai, Kouichi Moteki, Nobuyuki Watanabe, Youko Yamada, Kaoru Matsuo and
Katsuto Nakagawa
Geographical Survey Institute, Ministry of Construction, Japan
1, Kitasato, Tsukuba-Tsukuba-City, Ibaraki 305-0811, Japan
Tel : (81)-298-64-1111 ex (5553) Fax: (81)-298-64-3056
E-mail: okatani@gsi-mc.go.jp
Keywords: DEM, Airborne SAR, X band, Izu
Peninsula, GSI Geographical Survey Institute, Ministry of Construction, Japan
1, Kitasato, Tsukuba-Tsukuba-City, Ibaraki 305-0811, Japan
Tel : (81)-298-64-1111 ex (5553) Fax: (81)-298-64-3056
E-mail: okatani@gsi-mc.go.jp
Abstract:
Geographical Survey Institute (GSI) has observed Izu Peninsula area, Central Japna, last February using Airborne SAR (X-band). The authors introduce several results, such as, visualized SAR images, DEM and counter maps. Then, they also show results of accuracy validation of DEM.
1. Introduction
It is very important to grasp the situation as soon as possible when a disaster occurs, but it is very hard to get information from the ground because there are a lot of things which prevent us from getting such important data such as clouds and volcanic eruptions. In case using a optical sensor, large amount of information is shout out by such barriers. On the other hand, SAR (synthetic aperture radar) is a shout out by such barriers. On the other hand, SAR (synthetic aperture radar) is a very useful method to collect information even if an observation area is covered with such obstacles or an observation is executed in nighttime because SAR uses micro waves and these waves are radiated by the sensor itself. Though SAR sensor is installed in some satellites, J-ERS, ERS, RADARSAT and so on, and observes the surface of the earth, but the sensor doesn't have enough resolution and interval between two observations is not so short to get appropriate information which is fast enough in case of emergency.
From these points of view, an observation by airplanes has lots of advantages, such as, resolution and quickness compared with observations by existing satellites. In the future, some satellites with higher resolution will be launched, and it is very important to investigate beforehand how much information we can get about a disaster from future satellites and how much we can use these information for map production. Geographical Survey Institute (GSI) of Japan has installed Airborne SAR(X band) in order to research and develop technology for those things in fiscal 1996 and 1997. GSI observed some places in Japan using our Airborne SAR in fiscal 1998 and made visualized images and DEMs. Then, the authors will report the results of the observation and the accuracy validation of DEM.
2. Observation
Feb. 25th, 1999, GSI observed Izu Peninsula area (Ito City) and Izu-Ohshima Island, Central Japan, which has high potential for disasters and which is expected to detect the crustal movement. The observation was done using two and three dimension mode, and the visualized images and DEM were produced. The information about the SAR sensor is shown in Table 1.
| Item | Performance |
| Frequency | 9.555 GHz (X band) |
| Band Width | 100MHz |
| Off-Nadir Angle | 55 ~75o (must be set beforehand) |
| Unit Bit Number | 4bit / 8 bit |
| PRF | 3~2000Hz |
| Polarization | HH |
| Sender Pulse Width | 10 m sec |
| Swath Width | ~5km |
| Resolution | Azimuth 1.5 m / Range 1.5m |
3. Analysis
In this paper, the authors introduce the data around Ito-City which is located in northeast area of Izu Peninsula. The observed area is shown in Figure 1 and visualized SAR image in Figure 2. The DEM is made by the composition of two SAR data which were observed at the same time. The DEM which was expressed by gradations is shown in Figure 3.
Next, the authors inspected the accuracy of the DEM. This inspection was done by comparing two DEMs, on e was made from aerial photograph and the other was made by the Airborne SAR data. However, we didn't compare the area where the data was missing because of invisibility from the airplane, such as, rear side of hills, buildings and so on. The compared DEM was made by scanning aerial photographs and matching these photo images with digital photogrammetric workstation.
4. Result
The observation date was a sunny day but windy day, then the plane rolled and pitched very much. It was very hard to get high -resolution data, and we used kinematic GPS data. Though there are some obscure area because of the strong wind, we can get detailed information, such as 1.5m resolution, in most area of the image. The features in the DEM by Airborne SAR, such as, valleys and hills almost correspond with the positions of these features shown in the topographical map.
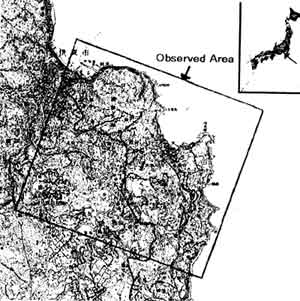
Figure 1 the basic map around observed area
(1:50,000 topographical map "Ito", published by GSI Japan)
The result of comparison between the DEM by Airborne SAR and by aerial photos is shown in Figure 4. The difference between two DEMs is around 8m for whole area and as good as 5m in some area. This result shows that we can get an accurate DEM whose residual is around a half of interval between two contours that are shown in 1:50,000 basic topographical maps.
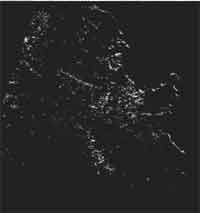
Figure 2. Visualized SAR Image
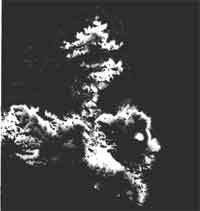
Figure 3 DEM image (gradations)
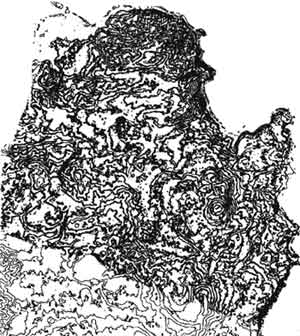
Figure 4 Comparing two DEMs, by Airborne SAR and aerial photographs
(Thick line : DEM by SAR Thin line : DEM by photo)