| GISdevelopment.net ---> AARS ---> ACRS 1999 ---> Agriculture/Soil |
Land Evaluation for combining
Economic Crops using GIS and Remotely Sensed Data.
C. Mongkolsawat P.
Thirangoon and P. Kuptawutinan
Computer Center Khon Kaen University
Khon Kaen Thailand 40002
Email: charat@kku1.kku.ac.th
Computer Center Khon Kaen University
Khon Kaen Thailand 40002
Email: charat@kku1.kku.ac.th
Abstract
In general, land evaluation for agricultural landuse is formulated by classifying lands with different capabilities. The suitability for various potential land uses is identified in relation to individual crop requirements. Within the planning area, an assessment of crop combinations is needed in order or to lessen a price risk. This evaluation was then formulated with objective of classifying units of land as to their suitability for combining economic crops using GIS and remotely sensed data.
The study area, Song Kran Watershed covers extensively in the Sakon Nakhon basin, Northeast Thailand with an area of about 13,080 km2. The major economic crops in the area are rice cassava, sugar-cane and pasture crops. The suitability assessment for each crop was conducted using the method as described in FAO guidelines for land evaluation for rain fed agriculture. For each crop, land unit was created from overlay process of the defined theme layers or land qualities on which the suitability is based. As a result, suitability map layers with their associated class attributes for rice cassava, sugar-cane and pasture crops were obtained. Furthermore, the overlay process was then performed on these suitability map layers with selection criteria of only highly and moderately suitable classes. The resultant map obtained is a result of combination of the defined suitability class of combining crops. (rice, cassava, sugar-cane and pasture) within the area. Economically, the planning alternative that best matches landuse to land suitability should therefore be the most valuable and efficient.
Introduction
In Northeast Thailand, the agricultural land use cover an area of 71.09%, rice and field crops share about 44.78 and 25.41% respectively (Land Development department LDD 1989). The major field crops in the watershed are sugar-cane and cassava which occupy the upland, well drained soils. Pasture is a major consumer of water so the planners are interested in developing the livestock. The suitability of land for rice, sugar-cane, cassava and pasture is needed to maximize the production.
FAO guideline on the land evaluation system (1983) is widely adopted. The system was based on defined land qualities as related to individual crop. Establishment of land unit that best matches land use to its suitability is principle concept used. Sys et.al., (1991) applied the FAO concept and developed the crop requirements based on the experiment/experiences in tropical areas. Bo-heng (1990) established spatial model for land evaluation for suitability spatial model for land evaluation in China using remote asnsing data and GIS. FAO (1983) also suggested the land evaluation for suitability of crop combination can support the alternatives for the proper decision. This suggestion is due to markets and prices that are liable to change from one crop to another. Consequently, development of land suitability map for combining crops is needed in order to reduce the price risk. There still needs to develop the modeling of land suitability for crop combination using computer based GIS and remote sensing data. The principal purpose of this study is to classify the land in relation to its suitability for crop combination using GIS and Remotely sensed data.
Study Area
The study area, the Song Kram Watershed, is located in Northeast Thailand and covers an area of about 13,081 km21. Mean annual rainfall ranges 1300-1800 m.m. Geologically, the Song Kram is formed by thick sequence of Mesozoic sediment, the Korat group ranging in age from upper Triassic to Tertiary. The extensive area is formed by flat to gently undulating alluvial plains, which are drained easterly flowing drainage system. Apart from the gently undulation plains, the other prominent topography of the area is the Phu-Phan range which lies the southern part of the watershed. Paddy fields, field crops and the remnant of dipterocarp trees are common on the undulation plains. The dry dipterocarp forest is the main type found on the Phu-Phan mountain range. Soils are formed from alluvium, and have inherently low in fertility.
Methodology
The suitability evaluation for each crop (rice, cassava, sugar-cane and pasture crop) was based mainly on the method as described by FAP (1983). For each crop, land units resulting from the overlay process of the selected land qualities were established. The selected land qualities include water availability (W), oxygen availability (O), nutrient availability index (NAI), water retention capacity (R) root conditions (D), salt hazards (S) and topography (T). the requirements of each crop were reviewed from a number of publications (FAO (1983), FAO (1991), LLD (1990), Sys et al (1993), Delante (1993)) in combination with experimental reports and regional experiences. Determinations of the various factor rating and values assigned for each land quality are summarized in the table 1,2,3 and 4 for rice, cassava, sugar-cane and pasture respectively. Each land quality is a thematic layer in the GIS in which contains spatial data and its associated attributes.
| Land use requirment | Factor rating | |||||
| Land Quality | Diangnostic factor | unit | 1.0 | 0.5 | 0.5 | 0.2 |
| Water availabity (W) | Annual rainfall | m.m | >1,500 | 1100-1500 | 500-1000 | <800 |
| Oxygen availability (O) | Soil damage | - | poor/very poor | poor | well | very well |
| Nutrient availability Index (NAI) | NAI | ³0.60 | 0.40-0.60 | 0.10-0.40 | <0.10 | |
| N P K PH |
% ppm ppm - |
>0.2 >25 >60 5.6-7.3 |
0.1-0.2 10.25 30.60 7.4-7.8 5.1-5.5 |
<0.1 <10 <30 7.9-8.4 4.0-5.0 |
- - - >8.4 <4.0 | |
| Water retention capacity (R) | Soil texture | - | CL, Si, SCL, SiL, C, AC | L, SiCL, SiC, SL | LS | G, S, SC |
| Root Conditions (D) | Soil depth | om | >50 | 25-50 | 15-25 | <15 |
| Salt hazards (s) | Soil salinity Potential | - | High | Medium | Low | non saline |
| Toporgrephy (T) | Land from and slope | - | FL | LT | MT, HT, Fs, M slope <5% | MT, HT, Fs, M, slope>5% |
| Land use requirment | Factor rating | |||||
| Land Quality | Diangnostic factor | unit | 1.0 | 0.8 | 0.5 | 0.2 |
| Water availabity (W) | Annual rainfall | m.m | 1,100-1500 | 900-1100 1500-2500 |
500-900 2500-4000 |
^lt;500 >4000 |
| Oxygen availability (O) | Soil damage | - | well | moderate | poor | very poor |
| Nutrient availability Index (NAI) | NAI | ³0.60 | 0.40-0.60 | 0.10-0.40 | <0.10 | |
| N P K PH |
% ppm ppm - |
>0.2 >25 >60 6.1-7.3 |
0.1-0.2 6.25 30-60 7.4-7.8 5.1-6.0 |
<0.1 <6 <30 7.9-8.4 4.0-5.0 |
- - - >8.4 <4.0 | |
| Water retention capacity (R) | Soil texture | - | L, Si, SiL, SC, L, CL | SiCL, LS, SiL | SlC, S | C, G, SC, AC |
| Root Conditions (D) | Soil depth | om | >150 | 100-150 | 50-100 | <50 |
| Salt hazards (s) | Soil salinity Potential | - | High | Medium | Low | non saline |
| Toporgrephy (T) | Land from and slope | - | MT, HT, Fs, M, slope <5% | MT, HT, Fs, M, slope 5-12% | MT, HT, Fs, M, slope 12-20% | MT, HT, Fs, slope >20%, FL, LT |
| Land use requirment | Factor rating | |||||
| Land Quality | Diangnostic factor | unit | 1.0 | 0.8 | 0.5 | 0.2 |
| Water availabity (W) | Annual rainfall | m.m | 1600-2500 | 1100-1600 2500-3000 |
900-1100 3000-4000 |
<900 >4000 |
| Oxygen availability (O) | Soil damage | - | well | moderate | poor | very poor |
| Nutrient availability Index (NAI) | NAI | ³0.60 | 0.40-0.60 | 0.10-0.40 | <0.10 | |
| N P K PH |
% ppm ppm - |
>0.2 >25 >60 5.6-7.3 |
0.1-0.2 10.25 30.60 7.4-7.8 5.1-5.5 |
<0.1 <10 <30 7.9-8.4 4.0-5.0 |
- - - >8.4 <4.0 | |
| Water retention capacity (R) | Soil texture | - | L, Si, SiiCL,SiL, SCL, CL, SL | LS | SiC | C, G, S, SC, AC |
| Root Conditions (D) | Soil depth | om | >100 | 50-100 | 25-100 | <25 |
| Salt hazards (s) | Soil salinity Potential | - | High | Medium | Low | non saline |
| Toporgrephy (T) | Land from and slope | - | MT, HT, FS, M, slope <5% | MT, HT, FS, M, slope 5-12% | MT, HT, FS, M, slope 12-20% | MT, HT, FS, Mslope > 20%, FL, LT |
| Land use requirment | Factor rating | |||||
| Land Quality | Diangnostic factor | unit | 1.0 | 0.8 | 0.5 | 0.2 |
| Water availabity (W) | Annual rainfall | m.m | 1,500-4000 | 1000-1500 400-1000 |
400-1000 | <400 >6000 |
| Oxygen availability (O) | Soil damage | - | well | moderate | poor | very poor |
| Nutrient availability Index (NAI) | pH | - | 5.1-6.5 | 6.6-7.3 4.5-5.0 |
7.4-8.4 4.0-4.4 |
>8.4 <4.0 |
| Water retention capacity (R) | Soil texture | - | L, Si, SiL, SCl, SL, SiCL, CL | LS | C, AC, G, SiC, S | SC |
| Root Conditions (D) | Soil depth | om | >50 | 25-50 | 15-25 | <15 |
| Salt hazards (s) | Soil salinity Potential | - | High | Medium | Low | non saline |
| Toporgrephy (T) | Land from and slope | - | MT, HT, FS, M, slope <12% | MT, HT, FS, M, slope 12-20%, LT | MT, HT, FS, M, slope 20-35%, FL | MT, HT, FS, M, slope >35% |
Remark
Soil texture : C=Clay, CL=Clay Loam, L=Loam, Si=Silt, Sil=Silty Loam, SiC=Silty Clay, SL=Sandy Loam, LS=Loamy Sand, SCL=Sandy Clay Loam, Sicl=Silty Clay Loam, S=Sand, G=Gravel soil, AC=Alluvial Complex, Sc=Slope Complex
Salt hazard : 1=very high, 2=high, 3=mederate, 4=low, 5=underlying salt rock, 6=none
Land form : FL=Flood Plain, LT=Low Twrrace, MT=Middle Terrace, HT=High Terrace, FS=Foot Slope, M=Mountain
The water availability was based on the amount of annual rainfall. The nutrient availability index based on the method developed by Radcliffe et al (1982) and is given by NAI=N*P*K*pH. The spatial information for each diagnostic factor of NAI can be derived from LDD soil map. For pasture crop the pH is only a factor for NAI. The water retention capability is extracted from the diagnostic of soil texture and particle size. Moreover, soil map can provide information about root condition and salt hazards. The topography is a combination of slope gradient and landform which are derived using digital evaluation model and satellite data respectively. Each of land qualities with their associated attributes are digitally performed in a GIS to eventually produce the thematic layers. The factors rating defined in the table 1, 2, 3 and 4 were attribute database as related to diagnostic factors.
The evaluation model for each crop is defined using the value of factors rating as follows: suitability=w*O*NAI*D*S*T. the overlay process of these layers was performed to produce a resultant polygonal layer upon which the evaluation model was applied. The resultant layers yield suitability maps for rice, cassava, sugar-cane and pasture. The suitability maps have 4 classes according to the resultant values as presented in the table 5. Furthermore, the overlay process was then performed on these suitability layers with selection criteria of only highly and moderately suitable classes. The land suitability map for combination of the selected crops can be produced accordingly.
| Value | Class |
| >0.2 | Highly suitable |
| 0.1-0.2 | Moderately suitable |
| 0.01-0.1 | Marginally suitable |
| <0.01 | Unsuitable |
Results and Discussion
The suitability map for economic crops is a combination of the selected crops with selection criteria of only highly and moderately suitable classes (Figure 1). The suitability area of the crops is shown in table6.
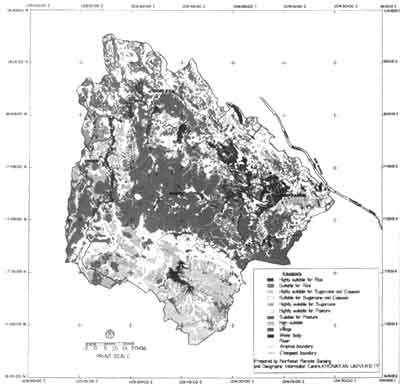
Figure 1: Land Suitability for Economic Crops Song Kram Watershed NE Thailand
| Class | % | Km2 |
| Highly suitable for rice Suitable for rice Highly suitable for sugar-cane / cassava Suitable for sugar-cane/cassava Highly suitable for sugar-cane Highly suitable for pasture Suitable for pasture Non-suitable |
7.31 0.09 11.71 0.34 1.44 31.37 36.04 5.92 |
955.50 11.20 1571.83 44.15 188.71 4091.16 4701.82 761.51 |
| Village Water body |
2.62 3.16 |
341.97 413.58 |
| Total | 100 | 13081.47 |
The study provides information about the suitability of land for not only a combination of selected crops but also individual crop. This is offer the alternatives for agricultural land uses to lessen the price risk. The area have inherently low nutrient status so that the pasture crops are highly suitable and cover extensively in the study area. According to the land qualities in the area, the principal limiting factors are the soil depth and fertility. The result indicated that the highly suitable of the watershed is highly suitable for cassava and sugar-cane. It should be observed that the highly suitable area for pasture occupies the suitable area of the cassava and sugar-cane.
To valuate the reliability of the method developed, the suitability classes were checked against the crop yields. The crop yields of highly suitable class were on averages 4.17, 75 and 25 ton/ha for rice, sugar-cane and cassava respectively.
In construction suitability map of crop combination in the area can help support the alternatives to lesson the price risk. The alternatives for agricultural land use are dynamic and varied according to the marketing price of the product. The process of developing alternatives for the watershed then requires a method of selection, which has greatest value in terms of the cost effectiveness. The decision maker can maker the proper decision given sufficient knowledge.
In addition, GIS layer established can enhance the planning alternatives within the watershed with reasonable information in terms of location. Perspectively, economic analysis to determine the cost of input and the values of output in the suitability map is needed to make these tasks meaningful to planning.
References
- Bo-heng Li, 1990. Application of Remote Sensing and GIS, China's Land Survey, Evaluation and Administration. Proceeding of the 11th ACRS vol 11Nov. 15-21, 1990 Guangzhou, China.
- Delante, V.Z., 1993, Land Suitability Classification for Cassava, pineapple and rubber using GIS in A, Pluak Daeng, Rayong Prov. M.Sc. Res. Study, AIT Thailand.
- FAO. 1983. Guidelines: Land Evaluation for Rainfed agriculture soils Bulletin No. 52 Rome: 237.
- FAO. 1991. Guidelines : Land Evaluation for Extensive Grazing. FAO Soils Bulletin No.58. Rome:
- Land Development Department. 1975. Detailed reconnaissance Soil map. Sakhon Nakhon. Min. of Agriculture and Cooperatives.
- Land Development Department. 1975. Detailed reconnaissance Soil map. Nong Khai Min. of Agriculture and cooperatives.
- Land Development Department. 1975. Detailed reconnaissance Soil map. Udon Thani. Min. of Agriculture and cooperatives.
- Land Development Department. 1987. Detailed reconnaissance Soil map. Nakhon Phanom. Min. of Agriculture and cooperatives.
- Land Development Department, 1990. Land Evaluation for Economic crops. Min. of Agriculture and cooperatives.
- Land Development Department, 1993. NE Land use Planning. Document No. 05/06/36. Min. of Agriculture and cooperatives.
- Land Development Department, 1996. Land Evaluation for Economic crops. Min. of Agriculture and cooperatives.
- Radcliffe D.J. and Rochette L. Maize in Angonia. 1983. An analysis of factors production. Field Report 30, FAO/UNDP MOZ/75/011, Maputo.
- Sys. C, Ranst. V and Debaveye. J. 1991. Land Evaluation Part I, Part II Agricultural publication No. 7, ITC Ghent.
- Sys. C, Ranst. V Debaveye. J. and Beenaert. F. 1993. Land Evaluation Part III crop requirements. Agr. publication No. 7, ITC Ghent.