| GISdevelopment.net ---> AARS ---> ACRS 1999 ---> Agriculture/Soil |
Rapid Updating of Rice Map
for Local Government Using SAR DATA and GIS -In Zegcheng County, Guangdong
Province, China
Tan Bingxiang, Li
Zengyyuan, Che Xuejian
Institute of Forest Resources Information, CAF, Beijing, 100091
Email: tan@info.forestry.ac.cn
Institute of Forest Resources Information, CAF, Beijing, 100091
Email: tan@info.forestry.ac.cn
Abstract
For rice growing areas in the tropics, experience shows that SAR satellite sensor can provide the desired information due to acquiring images independently of cloud coverage or daylight conditions. The current study testifies the potential of SAR data for rice mapping. This paper discusses the methodology and result of using SAR data and GIS in updating rice map for the local government in Zengcheng County of Guangzhou province, South of China. The methodology was carefully laid out and was determined to be easily implemented on a semi-automatic basis to facilitate frequent updating of rice map.
1. Introduction
Rice is an important crop. Two third of the world's population are living in Asia where rice is the prime source of daily food. Rice is also an essential source of income for many countries in the tropics, making it an important social, political and economic factor. Consequently, decision-makers have place the collection of information about the actual and predicted state of rice crops on the top of their political agendas. The two most interesting parameters to know are rice areas and yield.[1]
In China rice is also an important food resource and production forecasting is very important for local and central planning. At district and county level, production estimates are made from farmer's reports on rice yield and area submitted to the local administration. The major difficulty associated with the collection of ground data in this way is the remoteness of many of the farming areas, especially for the upland varieties of rice. This means that their traditional surveys are both time-consuming and expensive. In addition, the information is often inaccurate crop-yield forecasts and subsequent difficulties for agricultural planners and managers on both a regional and national scale.
The requirement for inexpensive, synoptic information on crop acreage in remote sensing lends itself to the use of satellite imagery, which has traditionally, meant optical imagery. Unfortunately, satellites carrying optical sensors cannot acquire data regularly in tropical regions during the rainy season. The usefulness of optical satellite imagery from the Landsat and Spot missions for rice monitoring has therefore proved to be limited, as the main rice growing takes place during the rainy season when there is typically 90% cloud cover. In this situation, the all weather monitoring capability and particular instrument characteristics of Synthetic Aperture Radar(SAR) can provide a unique and timely source of data.[2,3]
Test sites in Zengcheng County of Guangzhou Province, South of China. Its landuse map was made in 1990 and currently maintained in the form of paper manuscripts. In the condition, the maps are easily lost, difficult to take care of and, most of all, time-consuming to update; therefore, it is almost impossible to update the information on annual basis. Meanwhile, there are large changes in this County in recent years because of the houses' buildings and new road's development. With the persistence of these problems and the recognition of current advancement of information technology. It is very necessary to update the old landuse map using remote sensing and GIS technology. In this paper we just updated the map of rice, not all land use types.
2. Objectives
The main objective of this study is to asses the usefulness of SAR data for rice area mapping, and to develop an operate for rapidly updating the 1:50,000 scale old rice map by using SAR data and GIS. The detail objectives are as follows,
- To identify rice crop using SAR data;
- To test the accuracy of the rice maps;
- To develop a method for updating rice maps.
3.1 Study area
Study area sites in Zengcheng city of Guangdong province, South China, which are approximately 52*63 km size. The center co-ordinates are 113044'31.5'' E, 23021'40''N. the topography is generally flat in south, with mountains in north. The rice growing area including both irrigated and rain fed rice. Irrigated rice production is confined to low lying plains and valley bottoms whilst rain fed rice production occurs on terraced fields in mountainous regions. In the current study area two harvests per year are common. The main growth period lasts from April to July and a second crop grow from August to November.
3.2 Data basis
Muli-temporal ERS-2 SAR data and RADARSAT data were available at 7 acquisition dates, namely RADARSAT: 11- April-1997, ERS: 1-June-97, 9-Jun-97, 6-Jul-97, 18-Aug-97, 14-Sep-97, 22-Sep-97. ERS-2 SAR images were acquired by the Chinese Satellite Remote Sensing Ground Station and processed to standard PRI format, the RADARSAT image was acquired and processed by Canada.
We also got the landuse map and topography maps at scale 1:50,000 and 1:100,000.
3.3 Old landuse map organization
Digitization of the old landuse map is required because there is currently no GIS database. In the actual implementation of the GIS in the local government, digitization will be done only once, that is, in the setting up of the database. After that, the rice map was extracted from the landuse map. Then the updated rice data will serve as the old rice data on the next annual update.
The digitization was done using a scanner. The output imagine from the scanner was processed by vectorization software, in which lines features were extracted. These line features were then imported into ARC/INFO coverage, where polygons were build and attribute codes were input. Finally rice information were extracted from landuse coverage, then the rice map was created (see Figure 1 and Figure 2).
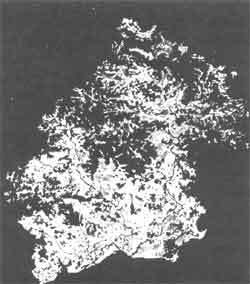
Figure 1 Landuse Map of Zengcheng county.
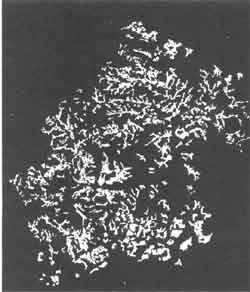
Figure 2 Rice map extracted from Landuse map.
4. Classification Methods
Two dates SAR data (11- April-97 RADARSAT and 6-July-97 ERS) and a difference image were selected for maximum likelihood supervised classification: channel 1, late date (before harvest), channel 2 early date (flooding period), and channel 3, backscatter differences between early and late dates (see figure 3), imagines geometric correction and radiometric correction were done, and Gamma MAP filter was also done for SAR imagines before classification. The results of the classification were rice maps covering Zengcheng County (see figure 4). The GPS surveyed data tended to be point samples associated with extensive irrigated rice areas. So far the accuracy of the supervised classification has been assessed and it is more than 90%.
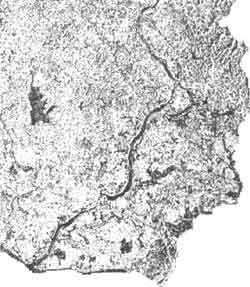
Figure 3 Parts of Composition SAR Image (Orange color is rice)
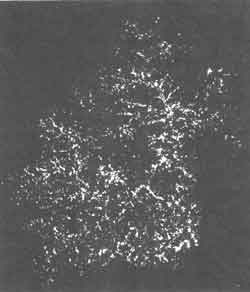
Figure 4 Rice Map Classified from SAR Image
5. Rice Map Updating
5.1 Raster to vector conversion
Since rice map must be maintained as a vector data set, it is necessary to convert the image raster data into vector format. Raster to vector conversions creates polygons using the raster region-edge as vertices. This process ordinarily produces jagged-edged polygons, and for single-pixel regions it will also produce very small square polygons the size of a pixel. Smoothing and elimination processes were employed as a part of the conversion process in order to produce a higher quality vector polygon data set for reduction of raster polygons area error. (See Figure 5).
Figure 5 Raster to vector conversion.
The smoothing effect of this process was done using a 5*5 majority in EDARS software. Elimination was carried out to remove very small polygons or portions of polygons that could not be meaningfully represented in a 1:50,000 map. The elimination procedure was performed using clumping and elimination. Clumping has a very similar effect to majority filtering and is a required processing step before elimination. Clumping also has a smoothing effect that removes very small raster regions and super thin parts of raster regions. It is also provides area size attribute in the raster regions. The area attribute is then used, by the elimination process, to actually remove selected areas of a minimum size. In this study, area less than ¼ hectare were eliminated.
5.2 Rice map updating
The rice map (1:50,000) updating process was carried out using the identity-overlay, selection and dissolve function of ARC/INFO. The selection process is the most complex part of the whole process, it detects rice area change while comparing old rice map (A) and rice map (B) from SAR, then creating the updated rice map (C). the equation is (1) if A=B then C=A or C=B; (2) if A is rice and B is not rice then C=0; (3) if A is not rice and B is rice then C=B. when C=A, the area will remain the same code and attribute as in A; when C=B, the area's code is B's code. It's other attribute will be added from the same area of A.
Finally, thee rice area boundaries were dissolved to come up with the updated rice map.
6. Result and Conclusion
The use of two images taken at the beginning and end of growing season has produced good classification results. The achieved mapping accuracy in the current study is more than 90% for rice fields against any other land cover.
Least two imagines should be available during the growth cycle. The optimum acquisition dates are during the flooded vegetative phase, and at the end of the growth. Three images during three-growth phase may be highly suitable for rice classification.
Speckle filtering of the input SAR data is mandatory before classification.
The methodology of updating rice map using SAR data and GIS is easily implemented. The updated rice map is very useful for local government.
References
- J.Aschbacher, A. Pongsrihadulchai, ERS SAR data for Rice Crop Mapping and Monitoring, Proceeding of the Second ERS Application Workshop, London, UK, 1995, pp.21-24.4.
- T.kurosu, Rice Crop Mapping and Monitoring using ERS-1 Data Based on Experiment and Modeling Results, IEEE IGARS, 1997, Vol.35, NO.1, pp.41-53.
- M. Yoshida, F.B. Barbero, Rapid Updating of Land-Use Maps for local Government in Japan through GIS and Remote sensing, ASIAN-PACIFIC Remote Sensing and GIS Journal, Vol.9, No. 2, 1997, pp.75-84.