| GISdevelopment.net ---> AARS ---> ACRS 1998 ---> Water Resources |
Study on the numerical
simulation of flow pattern in freshening reservoir using satellite image
data
Choi,
Moon-Soo1), Takashi Hoshi2), Kiyoshi
Torii3)
1)Graduate School of Science and Engineering, Ibaraki University,
4-12-1 Nakanarusawa, Hitachi, 316-8511, JAPAN
Tel : (81)-294-38-8235 Fax : (81)-294-23-7586
E-mail : moon@cis,ibaraki.ac.jp
2)Department of Computer & Indormation Sceinces, Faculty of Engineering,
Ibaraki University, 4-12-1 Nakanarusawa, Hitachi, 316-8511, JAPAN
Tel : (81)-294-38-5133 Fax : (81)-294-37-1429
E-mail : hoshi@cis.ibaraki.ac.jp
3)Division of Environmental Sciences & Technology, Graduate School of Agriculture,
Kyoto University, Kitashirakawa, Sakyo, Kyoto, 606-01, JAPAN
Tel, Fax : (81)-75-753-6459
E-mail : torii@kais.kyoto-u.ac.jp
Abstract1)Graduate School of Science and Engineering, Ibaraki University,
4-12-1 Nakanarusawa, Hitachi, 316-8511, JAPAN
Tel : (81)-294-38-8235 Fax : (81)-294-23-7586
E-mail : moon@cis,ibaraki.ac.jp
2)Department of Computer & Indormation Sceinces, Faculty of Engineering,
Ibaraki University, 4-12-1 Nakanarusawa, Hitachi, 316-8511, JAPAN
Tel : (81)-294-38-5133 Fax : (81)-294-37-1429
E-mail : hoshi@cis.ibaraki.ac.jp
3)Division of Environmental Sciences & Technology, Graduate School of Agriculture,
Kyoto University, Kitashirakawa, Sakyo, Kyoto, 606-01, JAPAN
Tel, Fax : (81)-75-753-6459
E-mail : torii@kais.kyoto-u.ac.jp
This study carries out a numerical simulation of inflow and outflow by grid generation in order to examine the mixing process of sea water and fresh water, which applied to Yongam lake in the southwestern of Korea. And then, the Landsat TM imagery are used to analyze freshening process and mixing pattern using the different reflective features between sea water and fresh water. As a result, the simulation is performed successfully using computational grids, those generated for the case of before and after of the enclosure in Yongam lake. The Landsat TM data classification interpreted the freshening process and the mixing pattern of influent water, stagnant water and sea water et at. In freshening reservoir.
Introduction
The comprehensive tidal land reclamation projects in Korea have been implementing for satisfying the demand of land and water resources increased since the beginning of 1970s. The Projects are also construct a freshening reservoir which supply irrigation water to the reclaimed land and existing surrounding farmland. However, the construction of freshening reservoir is in conflict with the preservation of natural environment. This study is associated with the analysis of the sequence of changes and phenomena including environment in the freshening reservoir.
A standard freshening reservoir consists of three kinds of mechanisms comprising convective freshening in an upper layer, the vertical diffusion through a spring layer and the mixing action in the bottom of a lake in freshening process1). The first mechanism of convection by inflow is very important phenomenon that relates to freshening process and water quality.
This study carries out a numerical simulation of fluid flows and image classification using Landsat TM data to analyze the convective mechanism of freshening reservoir. The former shows the flow simulation of inflow and outflow by grid generation in order to examine the situation of the mixing process of sea water and fresh water. The later analyzes the freshening process and mixing pattern using the different reflective featues between sea water and fresh water.
These methods are applied to Yongam lake in the south-western of Korea, which have been executing the comprehensive tidal land reclamation. This paper also examined the method to investigate the influent flow pattern and the relation to the water quality of Yongam lake.
Computational grid generation of study area
Study area
The study area of this paper is the Yongsam lake of Yongsan river comprehensive agricultural development projects third stage, located in the southwestern coast of the Korean peninsula(Fig.1). The length of enclosure like in this district is 2.2 km, the water resources to be developed by desalination is 153 million m3 and the area of water reclaimed land is 6,730 ha. The river basin of Yongam lake has a lot of small stream influent only in the rainy season. The inflow of all the stream is calculated in three places and five places respectively, the time before and after the completion of enclosure dike in Yongam lake, as shown in Fig. 3 The catchment area is relatively small compared with the area of lake, and the inflow also in insufficient to desalt. Therefore, the connection canal to desalt by introducing fresh water from adjacent Yongsan river estuary has been already completed and operated voluntarily according to inflow without intervals.
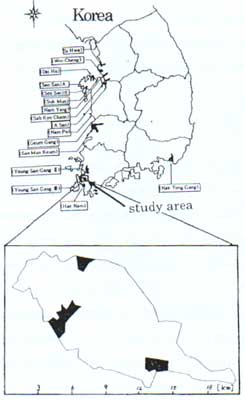
Fig 1. Location of the study area
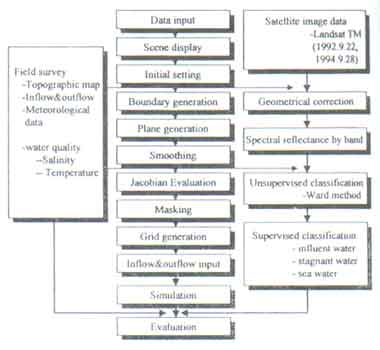
Fig 2. Flow chart showing various Steps of this study
Grid generation
The grid generation used the transfinite interpolation for the different times in Yongam lake and applied to boundary adaptive curvilinear coordinate grid. The outline of the grid generation is shown in Fig. 2 and these steps are follows.
First, the representative sides are generated by linking the representative points decided to locations which have topographical features and the changes of water flows. Second, The grid points are generated onto the representative sides of equal and unequal intervals.. If it have an equal interval, the grid number is divided in proportion to distance between the representation point of both sides. However, the division of unequal intervals is used the linear interpolation using Robert's equation. Third, smoothing is executed using Lagrangian interpolation on the whole area. The smoothing has two kinds of method whether smoothing will perform or not for grid point onto the boundary. Fouth, the Jacobian evaluation of the grid generation put into practice to examine overlapping representative sides on the same axis. Finally, the masking is described as a black mark these not included computational area.
The grids generated by these steps are 194 points in vertical plane and 55 points in horizontal plane for the direction of the mouth of a river in the area before enclosure, 210 points and 56 points separately in the area after enclosure, as shown in Fig. 3.
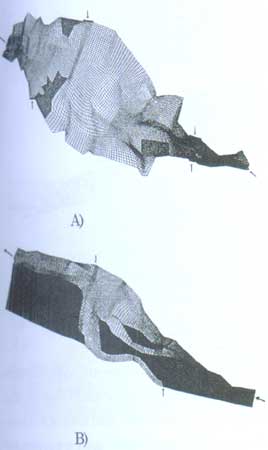
Fig3. Gird generated in the area of A) before and B) after enclosure
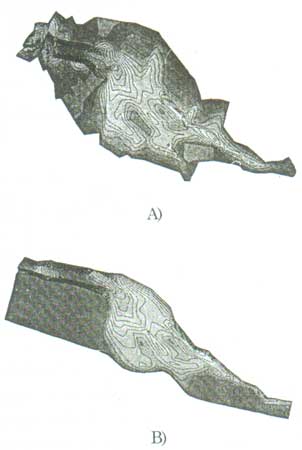
Fig4. Contour line of eater depth in the area
Numerical simulation of inflow flows
The long wave equation utilized as equation for the numerical analysis of flow fields is defined as follows
Where h : displacement of water surface
q: liner discharge vector,
t : time ,
h: water depth,
g: acceleration of gravity,
n: kinetic viscosity
fe : coefficient of friction,
Ñha, Ñh, Ñh2. divergence of horizontal level and gradient, Laplace operator respectively. The numerical analysis ois applied to the method associated time integral method with four-step Runge-Kutta scheme and full implicit method. The representative values are shown in Table 1, where L0 means the average of water rapidly by using the value of the water depth in Yongam lake. The viscosity 1.0 X 10³[m2/s] so that grid number is increased rapidly by value of the water temperature of 20°C, 1.0 X 10³[m2/s].
| Length [L0] | 10.0[m] |
| Velocity [U0] | 9.899[m/s] (=ÖgL0) |
| Time [T0] | 1.0102[s] (=L0/U0) |
Application of satellite image data
The satellite image date used in this study is Landsat TM images those are utilized to analysis on the flow pattern and analysis of mixing process in the freshening reservoir. These are the image date observed on Sep. 22, 1992 and on Sep. 28, 1994, the time before and after of full scale dsalination in Yongam lake. Geometric correction by ground control points used a topographic map of 1:50,000 scale published in Korea in September 1995.
These bands can be used to interpret outflow pattern and the phenomenon of water area for band1, to examine spectral reflectance for band2 and to analyze turbidity for band35). In the first place, the values of CCT count were investigated for each band of Landsat TM images to examine the characteristics of ban data using two kinds of satellite image data taken in different times. The IBASYS software, a kind of image processing system operating on the workstation of Remote Sensing/GIS laboratory at Ibaraki University was used to perform geometric correction and classification. Eight ground control points were selected from the topographic map of 1:50,000 scale. The absolute difference between the calculated and measured values of the image coordinates was kept down within 1 pixel. Affine transformation was used for image coordinates corresponding to topographic coordinates.
The CCT values of each Band were investigated at 3 places in sea, and 6 places in freshening reservoir along the center line of the sea and freshening reshening reservoir that standard points are the centrer of enclosure dike.
Discussion and conclusions
The value of CCT count examined for sea water and fresh water along the center line of the Yongam lake. The image date of 1992 does not show the variance of sea water and fresh water, but the 1994 data shows the variance for band1,2 and 3. toward the upstream of the freshening reservoir. These data show the existence of stagnant water body from the enclosure dike to the center of Yongam lake.
In the numerical simulation of inflow flows, Fig5 shows conditions that influent water from the inlet of 5 places is diffusing toward the middle of lake. The mixing process does not change rapidly because the inflow from river basin is of little quantity of 4.38 m3/s, that the value is confirmed in field survey that the inflow is little except the rainy season.
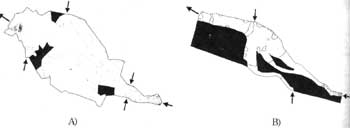
Fig.5 An example of numerical simulation by grid generation In the are of A) before and B) after enclosure
However, the inflow after the enclosure of dike is increased greatly by introducing surplus water through connection canal, which can be discharged maximum 257 m3/s in full opening time. The discharge is average 2311m3 a year for recent 3 year, affects absolutely in the flows of Yongam to understand the flow pattern of inflow.
Fig.6 is the classified images for land cover and the situation of freshening process in three freshening reservoirs using the Ward's method of unsupervised classification method. Fig.7 is an classified image by the MLH method of supervised classification method. These classifications are able to interpret the freshening process and the mixing pattern of influent water, stagnant water et al. in freshening reservoir. Fig.8 shows salinity change by year in the downstream of Yogam lake that corresponds to the result of image classification. The methods using a numerical simulation and satellite image date adopted in this study can be effectively used to the environmental investigation of water area as Yongam lake.
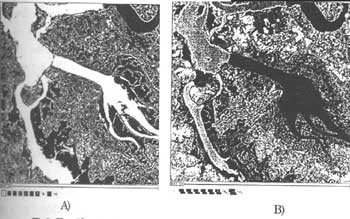
Fig6. Classification images by the Wardsmethod of unsupervised classification in A) Sep. 22, 1992 and B) Sep. 28, 1994.
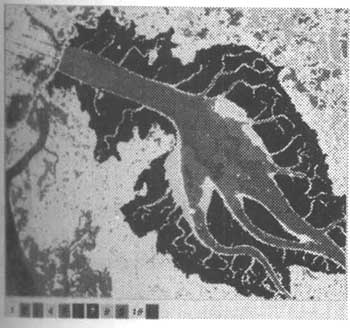
Fig7. Classification image by the MLH of Supervised classification in Sep. 22,1992.
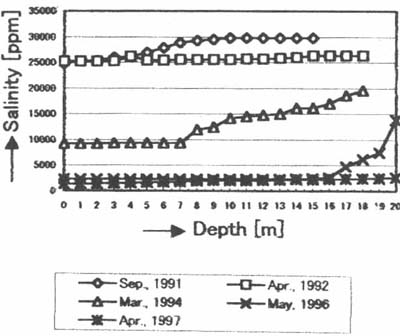
Fig.8. Salinity change by year in the downstream of Yongam lake
Finally, we are deeply grateful to Dr. Satoshi Chiba of Yokkaichi Univ., Japan for his cooperation in this study.
Reference:
- Isao Minami : Theoretical Study on Analysis Method of Freshening Process, Trans. Of the JSIDRE, Vol.(29), pp.8-13,1969.
- Choi M.S., T. Hoshi : Numerical simulation of current in estuary by bgrid generation. Proc. Of Annual Conference of JSPRS, F-5 pp.203-206, 1998.
- Torii K, T. Hoshi et al. : Investigation on Tidal Land Reclamation in Korea Using Satellite Image Data, Proc. Of the 17th ACRS, G-4-1~6,1996.
- Hoshi T.,K.Torii, M.S. Choi : Characteristic Analysis of Water body in Tidal Land Reclamation Area using Landsat TM Image Data, Proc. Of the 18th ACRS, P-9-1~6,1997.