| GISdevelopment.net ---> AARS ---> ACRS 1998 ---> Water Resources |
Short Duration Rainfall
Estimation Using GMS IR and VIS Images
Flaviana D.Hilario,
Ph.D. CAB,PAGASA,DOST
1424 Quezon Ave., Quezon City, Phil.
Tel/Fax: 373 34 33
E-mail: cab@philonline.com.ph
AbstractPh.D. CAB,PAGASA,DOST
1424 Quezon Ave., Quezon City, Phil.
Tel/Fax: 373 34 33
E-mail: cab@philonline.com.ph
Point estimates of hourly, 3-hr, 6-hr and 12-hr rainfall from tropical cyclones were computed using 3-hr interval of infrared and visible images from the Geostationary Meteorological Satellite (GMS) of Japan. Regression models involving liner combination of IR and VIS was used to estimate short duration rainfall. Independent data were used to validate the models.
It was observed that high rainfall values are always associated with high IR brightness value but high IR brightness value is not always associated with high rainfall values. The total time period of the rainfall estimation appears to be an important factor in the accuracy of the estimation. In general, the estimated rainfall for the periods hourly, 3-hr, 6-hr and 12-hr showed overestimation for lower rainfall values and underestimation for higher rainfall values.
Introduction
Rainfall measurement is very important in many aspects of both operational and research meterology, climate monitoring, hydrology, and ecology. Unfortunately, the present network for rainfall monitoring by conventional means such as raingauges is deficient in many areas in the world, the more so if rainfall data are required very quickly. Many raingauge network provide data monthly or even less frequently, and with time-lags which further restrict their utility particularly for near real time applications. Satellite-derived rainfall estimates may supplement these data or, in some cases, it may be the only data available.
Areal average and volumetric rainfall are helpful in qualitatively determining how "wet" a tropical cyclone is compared to other tropical cyclones but they do not give the forecaster what is really needed; namely, a spatial distribution of rainfall. For this type of information, point rainfall estimation is needed. Techniques that fall in this category aare those of Robertson (1995), Griffith-Woodley Rainfall Technique(GWRT), GOES Precipitation Index (GPI) developed by Arkin and Meisner(1987), Abe(1990), and Goodman, Menzel and Curtin Method (1991). The main objective of this study is to develop a short-duration point-rainfall estimation technique using visible and infrared images from GMS
Data and Methodology
Satellite Data: the data set used in this study is infrared (10.5-12.5m) and the visible (.55-.75m) images from the Japanese Geostationary Meteorological Satellite (GMS). Figures 1 &2 show sample of infrared and visible images used in the study. Four visible images at 3 hour interval (0031, 0331, 0631, 0931) for each tropical cyclones were initially planned to be utilized in the study. However, only T.C. Ditang has 4 visible images while T.C. Akang has 3. The resolution which is finer than the IR images is 1.25 km at sub-satellite point. The amount of solar visible radiation reflected by the clouds depends on the position of the sun in the sky, the latitude of the station and the time of the year. To take these factors in consideration, the visible brightness values were normalized (Negri and Adler, 1987) by multiplying with 1/SQT(cosz), where z is the solar zenith angel.
One of the satellite parameters used in this study is the IRBV at the rainfall station. The other satellite parameters were average brightness value (AveBV) of different grid size ranging from 3x3 to 21x21 where the rainfall station is located at the center of each grid. For example , for a 5x5 grid, the average brightness value of the 5x5 grid(AveBV5) was computed by adding the brightness values inside the grid and then, divided by the total number of pixels, which is 25 in the case. Similar procedure was followed for the other grid size.
Another satellite parameter tested in the study is the variance (VAR) for each grid size. Variance which is the square of the standard deviation is a measure of the texture of the image. Again, similar procedure to that of the brightness value was used to determine the VAR for the other grid sizes.
Rainfall Data: Rainfall data from PAGASA telemetering stations were used in this study. These stations normally record hourly rainfall data. Due to unavoidable circumstances such as power failure, there were times when some stations were unable to record hourly rainfall. During T.C. with complete 24 hr hourly rainfall data.
Discussion of Results
The following discussion tackles the probability of rain-no rain occurrence using infrared and visible parameters half and two & half hours after the satellite pass. This will be the basis of the choice of threshold values for both parameters. The main focus of the discussion, however, is the results of the regression analysis to determine the model/s for hourly, 3-hr, 6-hr and 12-hr rainfall estimation.
Rain-No Rain Delineation
Table 1 shows the rainfall probability half and 2.5 hour after the satellite pass using infrared data during TC Ditang(19 July 1992) and T.C. Akang (14 June 1990) at 3 hourly interval. For IR brightness values of less than or equal to 190, the probability that it is going to rain within the next half hour is very low. On the otherhand, for very high IR brightness values(236-240), the rainfall probability is 87% that indicates a very high probability of rain half-hour after the satellite pass. In general, there is an increasing probability of rain from column 1 to column 7. However, the results for columns` 2,3 and 4 cannot be considered as a trend due to limited number of cases. The results for 2.5 hr after the satellite pass are somewhat similar to that of the results for 0.5hr.
The results showed increasing rainfall probability as the temperature brightness decrease (IR brightness value increases). The same relationship was found by Lethbridge (1967) on the relationship between precipitation probability and satellite data from TIROS IV. The actual probability values, however, are not the same. This may be attributed to the differences in geographical locations of areas for which estimates were made (Martin and Howland, 1986).
| IR Brightness value | <191 | 191-200 | 201-210 | 211-220 | 221-230 | 231-235 | 236-240 |
| Total no. of Observations | 70 | 23 | 24 | 30 | 84 | 65 | 70 |
| Rainfall Prob'ty 1/2 hr after sat. pass | 4.3 | 26.1 | 37.5 | 46.7 | 50.0 | 53.8 | 87.1 |
| Rainfall Prob'ty 2.5 hr after sat.pass | 15.3 | 39.1 | 75.0 | 73.3 | 63.1 | 67.7 | 97.1 |
The rainfall probability half and two and half hours after satellite pass using visible brightness of T.C. Ditang and T.c. Akang are shown in Table 2. The rainfall probability for both cases increases as the visible brightness values increases. However, the results are not conclusive since the number of cases for visible brightness value greater than 160 are very limited. Most of the visible brightness values are less than 160 where the rain fall probability is only 14.5% for half hour and 23.6% for 2.5 hour after satellite pass.
| Visible brightness | <160 | 160-170 | 171-180 | 181-190 | 191-200 | 201-210 | >210 |
| ½ hr after sat pass | 14.5 | 28.6 | 33.3 | 80.0 | 87.5 | 76.9 | 100.0 |
| 2& ½ after sat pass | 23.6 | 42.9 | 50.0 | 80.0 | 100.0 | 100.0 | 100.0 |
| No. of observation | 55 | 7 | 6 | 5 | 8 | 13 | 9 |
Model Development
The following discussion centered on the development of models for short duration rainfall estimation using infrared and visible satellite date of T.C. Ditang for twelve hours (July 19, 1992) at 3 hour's interval. This involves four IR and four VIS satellite pictures taken at the following periods; 0031, 0331, 0631 and 0931.
The correlation analysis of average visible brightness (AveVis) with hourly and 3-houly rainfall is much higher than the correlation between IR(AveIR) and rainfall from the 3x3 to 21x21 pixel grid. For the variance of IR and VIS at different grids, the correlation coefficients are negative for hourly as well as 3-houly. This means that as the variance increases (or the less smooth the image is), the rainfall decreases.
The results also showed that the hourly and 3-hourly rainfall are better correlated with visible brightness than with infrared brightness. Similar findings were found by Abe(1990) and Griffith et al. (1978). The IR brightness measurement is more sensitive to the presence of cirrus cloud than the visible brightness. In the visible image, lower clouds are seen underneath the cirrus. The whiteness of the cold cloud tops obscures the lower level cloudiness. Cumulonimbus show up larger in the infrared image indicated due to the cirrus canopy.
In the regression analysis, only the IR and VIS brightness values at the stations were used. The correlation coefficients between IR and VIS brightness values for the different grids are comparable to that of the stations which is easier to determine. The variance was not included since r is small and a simpler equation is preferred.
Comparison of observed and estimated hourly rainfall using linear combination of VIS and IR parameters showed that the higher hourly rainfall are underestimated by the model and overestimated for lower rainfall. Similar findings were found for 3-hr, 6-hr and 12-hr rainfall estimation.
| Period | R | R2 | SEE | Tcomp |
| Hourly | .665 | .443 | 2.31 | 7.87* |
| 3-hr | .692 | .479 | 5.90 | 8.47* |
| 6-hr | .882 | .778 | 7.30 | 11.57* |
| 12-hr | .882 | .788 | 11.0 | 7.95* |
| Period | R | R2 | SEE | Tcomp |
| Hourly | .462 | .214 | 2.45 | 2.55* |
| 3-hr | .703 | .533 | 4.34 | 9.50* |
| 6-hr | .764 | .583 | 6.92 | 8.28* |
| 9-hr | .816 | .666 | 8.50 | 6.77* |
* Significant at a=0.05
Model Validation
The model were validated for four rainfall periods, namely, hourly, 3-hr and 9-hr using T.C. Akang. The summary of results for the different periods (Table 5) indicates that the correlation coefficients increased as the period of accumulation increased. The correlation coefficients are comparable to that of the derived models.
Summary and conclusions
Point estimates of hourly, 3-hr, 6-hr and 12-hr rainfall from tropical cyclones were computed using 3-hr interval of infrared and visible images from the Geostationary Meteorological Satellite (GMS) of Japan. Multiple regression models involving IR and VIS were developed to estimate short duration rainfall. Independent data were used to validate the models.
While high rainfall values were always associated with high IR brightness value, high IR brightness value did not always imply high rainfall values.
The total time period of the rainfall estimation appears to be a very important factor in the accuracy of calculations. The scatter of hourly and 3-hr estimates are relatively large however, the scatter decreases as estimates are accumulated over longer period of time.
In general, the estimated rainfall for the periods hourly, 3-hr, 6-hr and 12-h showed overestimation for lower rainfall values and underestimation for higher rainfall values.
Validation of the models using independent data sets (Akang) reveals slightly lower correlation coefficients for hourly, 3-hr, 6-hr and 9-hr rainfall estimation.
Reference
- Abe, Yoshiyki (1990). Precipitation intensity derved from GMS imagery. Meteorological Satellite Center. JMA.
- Arkin, Phillip A. and Bernard N. Meisner (1987). The relationship between large-scale convective rainfall and cold cloud over the Western Hemisphere during 1982-84. Monthly Weather Review, 115.
- Griffith, C.G., Woodley, W.L., Grube, P.G. Martin, D.W., Stout, J and Sikdar, D.N. (1978) Rain estimation from geosynchronous satellite imagery-visible and infraed studies. Mon. Wea. Rev. 106, pp 1153-1171.
- Goodman, B., W.P. Menzel, E.C. Cutrim and D.W. Martin (1993). A non-linear algorithm for estimating 3-hourly rain rates over Amazonia from GOES/VISSR observations. Remote Sensing Reviews.
- Leighbridge, Mae (1967). Precipitation probability and satellite radiation data. Monthly Weather Review . Vol. 95.pp 487-490.
- Martin, David W. and Michael R. Howland (1986). Grid History: A geostationary technique for estimating daily rainfall in the tropics. Journal of climate and Applied Meteorology. Feb.
- Negri, Andrew J. and Robert F. Adler (1987). Infrared and visible satellite rain estimation Part I: A cell grid approach. Journal of Climate and Applied Meteorology. Vol. 26. Now.
- Robertson, Frankin R. (1985). IR precipitation estimates in the South Pacific during FGGE SOP-1 Extended abstracts Volume; 16th Conference on Hurricanes and Tropical Meteorology, May 14-17, 1985, Houston, Texas. Published by American Meteorological Society, Boston, Mass. USA.
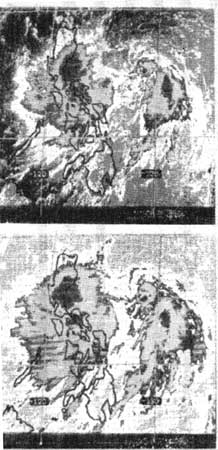
Fig.1 Visible (top) and Infrared (bottom) images of T.C. Ditang
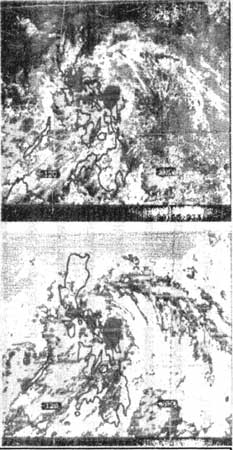
Fig.2 Visible (top) and Infrared (bottom) images of T.C. Akang
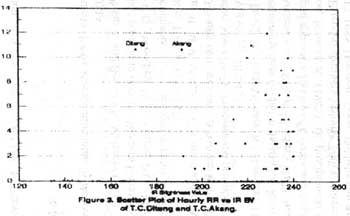
Fig.3 Scatter Plot of Hourly RR vs IR BV of T.C Ditang and T.C. Akang
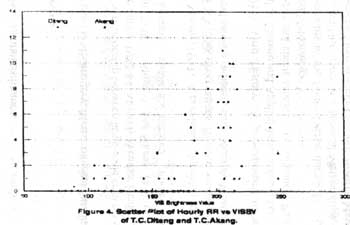
Fig.4 Scatter Plot of Hourly RR vs VISBV of T.C Ditang and T.C. Akang