| GISdevelopment.net ---> AARS ---> ACRS 1998 ---> Water Resources |
Detection of Coast Lines of
Tonle Sap Lake in Flood Season using JERS-1 Data for Water Volume
Estimation
Teng Peng Seang, Shunji Murai, Kiyoshi Honda, Robert L.G. Schumaan And Lal Samarakoon
STAR Program, Asian Institute of Technology
P.O. Box 4 Klong Luang, Pathumthani 12120, Thailand
Tel : (66-2)-2-524-5599 Fax : (66-2)524-6400
E-mail: murai@ait.ac.th
Teng Peng Seang, Shunji Murai, Kiyoshi Honda, Robert L.G. Schumaan And Lal Samarakoon
STAR Program, Asian Institute of Technology
P.O. Box 4 Klong Luang, Pathumthani 12120, Thailand
Tel : (66-2)-2-524-5599 Fax : (66-2)524-6400
E-mail: murai@ait.ac.th
Abstract
The study aims at the detection of coast lines of the Tonle Sap Lake, Cambodia in flood season using JERS-1 SAR Data for the estimation of the total volume of the lake.
JERS-1 SAR Data were mainly used together with other data such as JERS-1 AVNIR, ERS-1 SAR, LANDSAT TM, NOAA AVHRR etc. as well as topographic maps and hydrological records
The detection of coast lines at different water levels from 1.0 meter to 10.0 meters (the maximum water level) were partially made and the interpolation of the coast lines at 1 meter interval were implemented using a linear function.
The water depth of the lake at the minimum water level was estimated by applying a regression model with the correlation between brightness temperature of NOAA AVHRR and shallow water depth with less than one meter.
The results obtained from the study would be very useful for water use planning and flood management of the Tonle Sap Lake.
Introduction
The Tonle Sap Lake, Cambodia is the biggest lake in the Southeast Asia, though the exact water surface and volume in dry and flood season is still unknown. It is very important for Cambodia to use this lake on sustainable level for fishery, flood control, transportation, sightseeing etc.
During the flood season from June to October, a great amount of water flows up to the Tonle Sap Lake from the Mekong and Tonle Sap River with the water level increasing by 8~10 meters. It will work as a huge reservoir to protect the capital city of Phnom Penh from flood. The lake in flood season will range several times in area and volume bigger than in the dry season.
Even in dry season with the minimum water level, the lake is very big with about 30 km in width and 100 km in length, that makes difficult to survey the water depth, even though the depth is very shallow with less than one meter.
Objectives
The objectives of the study are as follows:
1) To produce a water depth map in the dry season using a relationship between brightness temperature of NOAA AVHRR and water depth using measurements of actual surface temperature with respect to the depth.
2) To detect the coast lines at different times in the monsoon season up to the maximum water level using JERS-1 SAR data and other reference data.
3) To interpolate coast contour lines at one meter interval
4) To estimate the perimeter, water surface and water volume of the Tonle Sap Lake from the results of remote sensing data in comparison with the results from the existing topographic maps.
Water Depth Map in Dry Season
Four NOAA AVHRR scenes (15:19, 03 April, 1998, 13:08. 07 April 1998, 15:31, 11 April 1998 and 14:36, 16 April 1998) were used to make cloud free mosaics of the Tonle Sap Lake at the minimum water level.
From the measurements of water surface temperature and water depth at the site implemented on 22nd to 26th April 1998, we found that the afternoon water surface temperature (13:00-15:00) on the 22nd April had a high correlation with the water depth as shown in figure 1. Then brightness temperature of NOAA AVHRR data were found to be highly correlated with the corresponding water depth with the high correlation factor as shown in figure 2. The water depth map was produced with the above regression model as shown in Figure 3.
Coorrelation between Water Surface Temperature and Depth of
Tonlesap Lake, 22nd April 1998, from 13 to 15O'Clock
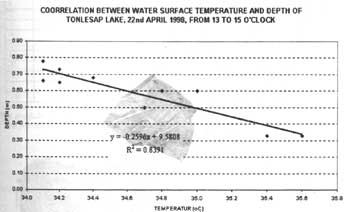
Figure 1 The Result of Correlation with Correlation Factor of 0.8391
The Relationship between Depth and Surface Temperature Detected by
NOAA/AVRR
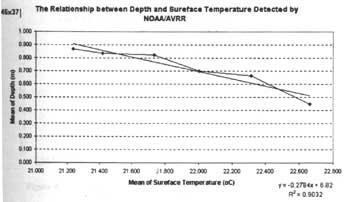
Figure 2 The Relationship between Depth and Brightness Temperatured Detected by NOAA/VHRR
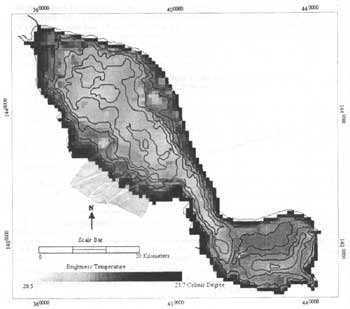
Figure 3 Estimated Depth Contour Map of the Tonle Sap Lake in the Dry Season from NOAA/AVHRR data
Detection of Coast Lines in Flood Season
It would be easy to detect water body with optical or thermal bands it its is exposed without any obstacle. However in case of the tonle Sap Lake area, the water boundaries are hidden with tropical forests, which results in difficulty to detect the coast lines with optical bands.
On the other hand, SAR data will have a stronge backscattering when tropical forests are submerged, due to the effect of corner reflection. A simple threshold with the value of 40 in the JERS-1 SAR band was used to automatically detect the coast lines that are submerged in tropical forest after several trials and errors.
JERS-1-SAR data as well as ERS-1 SAR data were used to detect the coastlines partially or completely depending on the data availability at different water levels during the flood season. From the leveling survey done by the first author, a linear interpolation was applied to estimate one meter contour of coast lines as shown in Figure 4.
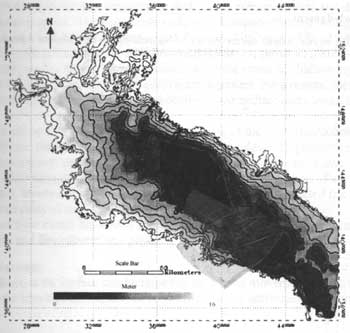
Figure 4 Estimated Contour Line Map of the Tonle Sap up to the Level of 10 Meters with JERS-1 SAR Data
Estimation of Water Volume
The existing topographic maps of 1:50,000 at one meter interval were produced in 1964 by the Philippines Government. Because of changes in land use and sedimentation as well as of surveying errors, the contour maps would be not fully reliable. In 1964 by the Philippines Government. Because of changes in land use and sedimentation as well as of surveying errors, the contour maps would be not fully reliable. In addition, there was not water depth available under the minimum from topo-maps.
From the ground survey to check the accuracy or justification of contour lines, we found that the contour lines obtained from the remote sensing data were much reliable. Table 1 shows a comparison of the water surface (S) and water volume (V) between the results from satellite data and topographic map.
Table Comparison of Perimeter, Water
Surface Area and Water Volume between the Result from Satelite imagery and
Existing Topographic Map.
*Not available in topographic map, but the same amount of satellite data was given.
**The percentage difference of water volume between the maximum water level in 5.6%
Discussion about Accuracy
As the total surface are of the Tonle Sap Lake ranges from 2,504 square kilometers (dry season) to 14,573 square kilometers (maximum flood level), while the perimeter from 465 kilometers (dry season) to 2,104 kilometers (maximum flood level), one or two pixel size error of 18 meter or 36 meters for JERS-1 SAR data that will be expected to give less influence to the accuracy of the water surface area. Suppose that 18 meters or 36 meters multiplied by the perimeter are the error of the surface area, the relative accuracy range from 0.33 percent to 0.66 percent (dry season) and from 0.26 percent to 0.52 percent (flood season) to the total surface area.
Height accuracy of interpolation of DEM will be around one third of contour line, that is about 0.3 meters, which will affect the error of the water volume more than the water surface area. As a whole, the accuracy of the water volume would be about 80 to 90 percent, though we need further study for accuracy check with reference survey.
Conclusion
Detection of coast lines of the Tonle Sap Lake in flood season with JERS-1 SAR data was successfully achieved with the results of water surface area and water volume, that was expected more reliable than the ones from the existing topo-maps.
Acknowledgement
The authors extend sincere thanks to National Space Development Agency of Japan (NASDA) for having provided JERS-1 SAR Data.
The study aims at the detection of coast lines of the Tonle Sap Lake, Cambodia in flood season using JERS-1 SAR Data for the estimation of the total volume of the lake.
JERS-1 SAR Data were mainly used together with other data such as JERS-1 AVNIR, ERS-1 SAR, LANDSAT TM, NOAA AVHRR etc. as well as topographic maps and hydrological records
The detection of coast lines at different water levels from 1.0 meter to 10.0 meters (the maximum water level) were partially made and the interpolation of the coast lines at 1 meter interval were implemented using a linear function.
The water depth of the lake at the minimum water level was estimated by applying a regression model with the correlation between brightness temperature of NOAA AVHRR and shallow water depth with less than one meter.
The results obtained from the study would be very useful for water use planning and flood management of the Tonle Sap Lake.
Introduction
The Tonle Sap Lake, Cambodia is the biggest lake in the Southeast Asia, though the exact water surface and volume in dry and flood season is still unknown. It is very important for Cambodia to use this lake on sustainable level for fishery, flood control, transportation, sightseeing etc.
During the flood season from June to October, a great amount of water flows up to the Tonle Sap Lake from the Mekong and Tonle Sap River with the water level increasing by 8~10 meters. It will work as a huge reservoir to protect the capital city of Phnom Penh from flood. The lake in flood season will range several times in area and volume bigger than in the dry season.
Even in dry season with the minimum water level, the lake is very big with about 30 km in width and 100 km in length, that makes difficult to survey the water depth, even though the depth is very shallow with less than one meter.
Objectives
The objectives of the study are as follows:
1) To produce a water depth map in the dry season using a relationship between brightness temperature of NOAA AVHRR and water depth using measurements of actual surface temperature with respect to the depth.
2) To detect the coast lines at different times in the monsoon season up to the maximum water level using JERS-1 SAR data and other reference data.
3) To interpolate coast contour lines at one meter interval
4) To estimate the perimeter, water surface and water volume of the Tonle Sap Lake from the results of remote sensing data in comparison with the results from the existing topographic maps.
Water Depth Map in Dry Season
Four NOAA AVHRR scenes (15:19, 03 April, 1998, 13:08. 07 April 1998, 15:31, 11 April 1998 and 14:36, 16 April 1998) were used to make cloud free mosaics of the Tonle Sap Lake at the minimum water level.
From the measurements of water surface temperature and water depth at the site implemented on 22nd to 26th April 1998, we found that the afternoon water surface temperature (13:00-15:00) on the 22nd April had a high correlation with the water depth as shown in figure 1. Then brightness temperature of NOAA AVHRR data were found to be highly correlated with the corresponding water depth with the high correlation factor as shown in figure 2. The water depth map was produced with the above regression model as shown in Figure 3.
Figure 1 The Result of Correlation with Correlation Factor of 0.8391
Figure 2 The Relationship between Depth and Brightness Temperatured Detected by NOAA/VHRR
Figure 3 Estimated Depth Contour Map of the Tonle Sap Lake in the Dry Season from NOAA/AVHRR data
Detection of Coast Lines in Flood Season
It would be easy to detect water body with optical or thermal bands it its is exposed without any obstacle. However in case of the tonle Sap Lake area, the water boundaries are hidden with tropical forests, which results in difficulty to detect the coast lines with optical bands.
On the other hand, SAR data will have a stronge backscattering when tropical forests are submerged, due to the effect of corner reflection. A simple threshold with the value of 40 in the JERS-1 SAR band was used to automatically detect the coast lines that are submerged in tropical forest after several trials and errors.
JERS-1-SAR data as well as ERS-1 SAR data were used to detect the coastlines partially or completely depending on the data availability at different water levels during the flood season. From the leveling survey done by the first author, a linear interpolation was applied to estimate one meter contour of coast lines as shown in Figure 4.
Figure 4 Estimated Contour Line Map of the Tonle Sap up to the Level of 10 Meters with JERS-1 SAR Data
Estimation of Water Volume
The existing topographic maps of 1:50,000 at one meter interval were produced in 1964 by the Philippines Government. Because of changes in land use and sedimentation as well as of surveying errors, the contour maps would be not fully reliable. In 1964 by the Philippines Government. Because of changes in land use and sedimentation as well as of surveying errors, the contour maps would be not fully reliable. In addition, there was not water depth available under the minimum from topo-maps.
From the ground survey to check the accuracy or justification of contour lines, we found that the contour lines obtained from the remote sensing data were much reliable. Table 1 shows a comparison of the water surface (S) and water volume (V) between the results from satellite data and topographic map.
| E1 | Satellite Data | Topographic Map | Difference | |||
| (m) | S (Km2) | V (Km3) | S (Km2) | V (Km3) | ÑS (Km2) | ÑV (Km3) |
| 1 | 2.504 | 17,624 | 2,504* | 1,624* | 0 | 0 |
| 2 | 3,602 | 4,588 | 3,367 | 4,733 | -235 | 145 |
| 3 | 4,410 | 8,467 | 4,558 | 8,907 | 148 | 440 |
| 4 | 5.237 | 13,133 | 5,695 | 14,105 | 458 | 975 |
| 5 | 6,532 | 18,724 | 7,078 | 20,639 | 546 | 1,915 |
| 6 | 7,932 | 25,657 | 8,281 | 28,425 | 298 | 2,768 |
| 7 | 9,201 | 34,049 | 9,367 | 37,341 | 166 | 3,292 |
| 8 | 10,276 | 43,477 | 10,458 | 47,357 | 182 | 3,877 |
| 9 | 11,743 | 54,156 | 11,458 | 58,453 | -153 | 4,297 |
| 10 | 14,573 | 66,740 | 12,859 | 70,753 | -17,14 | 4,013 |
*Not available in topographic map, but the same amount of satellite data was given.
**The percentage difference of water volume between the maximum water level in 5.6%
As the total surface are of the Tonle Sap Lake ranges from 2,504 square kilometers (dry season) to 14,573 square kilometers (maximum flood level), while the perimeter from 465 kilometers (dry season) to 2,104 kilometers (maximum flood level), one or two pixel size error of 18 meter or 36 meters for JERS-1 SAR data that will be expected to give less influence to the accuracy of the water surface area. Suppose that 18 meters or 36 meters multiplied by the perimeter are the error of the surface area, the relative accuracy range from 0.33 percent to 0.66 percent (dry season) and from 0.26 percent to 0.52 percent (flood season) to the total surface area.
Height accuracy of interpolation of DEM will be around one third of contour line, that is about 0.3 meters, which will affect the error of the water volume more than the water surface area. As a whole, the accuracy of the water volume would be about 80 to 90 percent, though we need further study for accuracy check with reference survey.
Conclusion
Detection of coast lines of the Tonle Sap Lake in flood season with JERS-1 SAR data was successfully achieved with the results of water surface area and water volume, that was expected more reliable than the ones from the existing topo-maps.
Acknowledgement
The authors extend sincere thanks to National Space Development Agency of Japan (NASDA) for having provided JERS-1 SAR Data.