| GISdevelopment.net ---> AARS ---> ACRS 1998 ---> Water Resources |
Development of 1 km Drainage
Model based on GTOPO 30 and Global Data Sets
Shiro Ochi and Ryosuke Shibasaki
Institute of Industrial Science, Univ. of Tokyo
7-22 Roppongi Minatoku Tokyo.106-8558 Japan
E-mail: ochi@cc.oos.u-tokyo.jp, shiba@skl.ii.u.-tokyo.ac.jp
Shiro Ochi and Ryosuke Shibasaki
Institute of Industrial Science, Univ. of Tokyo
7-22 Roppongi Minatoku Tokyo.106-8558 Japan
E-mail: ochi@cc.oos.u-tokyo.jp, shiba@skl.ii.u.-tokyo.ac.jp
Abstract
In order to develop hydrological models for flood and water resource analysis of river watersheds continental scale watersheds such as Yangzhy River(China). Mekong River, Brahmaputra/Ganges River, "Drainage Model", which has surface flow direction for each pixel in raster base, is very much required even in rough resolution of 1 km. In this paper, procedure to produce the drainage model is reported. In the first step, method to generate the flow direction using only the GTOPO30-1km digital elevation data-is introduced. However the generated river stream is not match with the stream lines in DCW(Digital chart of the world) and/or classified rivers in the land cover map using NOAA data. In the second step, a method to correct the primary drainage model is introduced, in which DCW and USGS 1 km land cover map is used to make reasonable stream lines. After the drainage model is established, topographical characteristics of watersheds, such as terrain features, land cover distribution and NDVI seasonal changes are analyzed for main rivers in the world. The developed drainage model can be applied to hydrological modeling.
1. Introduction
Drainage Direction Matrix (DDM) is defined as mesh data where each pixel has flow direction showing where the rain and the water body on a mesh flows. By making DDM, boundary of watershed can be delineated, calculation of watersheds area and hydrological analysis based on watersheds will be possible in computer. In order to make DDM, Digital Elevation Model (DEM) is used. If DEM express the detail of the real topography of the land, the flow direction of each pixel can be easily set. However, DEM usually include some error, and it represents a specific heights (ex. Mean Maximum or Minimum Height ) depending the mesh size, so it is difficult to obtain a consistent DDM from DEM.
The problems are the existence of concave pixel which has lowest height among the surrounding 9 pixels and no flow direction, and the existence of flat area where the heights of the neighboring 9 pixels are same. Both of the problems are quite complex and are picked up as subject for many study papers (Hayakawa, 1995, Lu, 1995).
And some solutions are also suggested (Nogami, 1998 ). But even the problems are solved, the computer extracted river systems are not always similar as actual river systems or map extracted river systems. In this case, manual correction comparing the computer products with reliable products are required however it will be difficult if the data size become huge.
In this paper, global DDM excluding Antarctica are produced using GTOPO30-global 30 second are DEM provided by USGS and some other global data sets. A similar products are now available as "HYDRO 1K, Elevation Derivative Database" at USGS which includes data sets of (1) Aspect, (2) Flow Direction , (3) Flow Accumulations (4) Slope (5) Compound Topographic Index. The URL of the site is :
http://edcwww.cr.usgs.gov/landdaac/gtopo30/hydro/index.html
However the available data of "HYDRO-1K" are only two-North America and Africa- and other continents -South America, Asia, Europe ad Australia- are still under the processing (October 1998 ). Furthermore, the algorithm and the accuracy of river network systems are not clear in "HYDRO- 1K" at this moment. This paper describes the detail of the developed algorithm for DDM generation and reliability of the extracted river systems.
2. Used Data
The used data to generate the global DDM are as follows :
GOTO30 30 seconds are Digital Elevation Model of the world lands, provided by USGS. The accuracy of the data is not qualified because the data sources are varied. GOTO30 is one of the precise mesh elevation data covering the entire world land area. The data is also available at following site, and detail of the data can be obtained.
http://edcwww.cr.usgs.gov/landdaac/gtopo30/gtopo30.html
DCW River Data Digital Chart of the world (DCW) includes the world river system (stream line ) data as "DNNET" coverage in LINE feature. Because the data is ARC/Info format, it is converted to 30 seconds grid raster format
WBDb-II River Data world Boundary Databank-II is data sets provided by U.S. Department of state (DoS)/ Central Intelligence Agency (CIA), and it includes the global river system data. Because the data is ARC/Info format, it is converted to 30 seconds grid raster format. The data density is no so high as DCW river data, and it means that river systems in WBDb-II data set are more significant river lines. The data can be obtained from UN/GRID
USGS 1 km Land Cover The data is provided. It is classified image using 1 km 10 days compo9site data from April 1992 to march 1993 combined with other global data sets such as GTOP30 and existing vegetation maps. There are 6 maps provided based on 6 category systems such as 1. Global Ecosystem Legend, 2. IGBP Land Cover Legend , 3. USGS Land Use/Land Cover system Legend, 4. Simple Biosphere Model Legend, 5. Simple Biosphere 2 Model Legend, 6. Biosphere atmosphere Transfer Scheme Legend. In this paper , " 3. USGS Land Use/Land Cover System lend" is used to get information of "water body" distribution which is not described in DCW nor WBDb-II data sets. The data can be obtained from following URL:
http://edcwww.cr.usgs.gov/landdaac/glcc/glcc.html
3. Algorithm
Drainage Direction (flow direction ) is set as the steepest descent direction among the neighboring 8 direction by using DEM. The problem in that the drainage direction can not be set at the concave pixel or flat area as mentioned in above. In order to sole the problem at concave pixel, a method increasing the altitude of the concave point to make over-flow to down stream is suggested and it is well known (Nogami, 1998). And fro flat area problem, some methods are reported to give certain drainage direction for such pixels to reach to bottom of the stream. In our experiences, if the target area covers within a few sheet of 1:50,000 scale map and pixel resolution is not more than 100mX100m, the automated extracted river system are vary similar to the reliable river system information, except flat area where the auto-extracted river line has a controlled direction to the down stream, and the streams do not run along the reliable stream lines in many cases.
In this study, global DDM is produced with 30 seconds are grid (about 1 km resolution at equator ) for lands. At first, DDM was produced by suing only GTOP30, correcting concave and flat area. It is confirmed the most of computer extracted streamlines rum in the bottom of topography ( vally ) whines it overlay with shading image derived from DEM, and most of them run along the streamlines of DCW and WBDb-II data sets within several pixels distortion. However some of the computer extracted streamlines have following problems and the problems make the accuracy of the DDM quite bad in some watersheds.
(1) for example, where three rivers- Yangzhu river, Mekong river and Tanlwin river-run closely at south of China, the computer extracted rivers make wrong watersheds due to the confused DDM. It was easy to detect such wrong river systems because the wrong watersheds are enough big to detect. However similar confusion must be happening in smaller watersheds and they are difficult to detect.
(2) The automated extracted river systems in flat area have artificial controlled direction.
(3) Some watersheds have no outlet to ocean such as rivers in Tibetan Plateau. These Closed water sheds can not be defined by using only DEM.
So there are some but serous differences between computer extracted streamlines and reliable streamlines described in Atlas or existing data sets, and they are difficult to detect and correct by manual work. An algorithm introduced below makes consistent DDM and streamlines using reliable data sets such as DCW, WBDb-II and satellite classified information.
(1) An integrated water body/non water body mask image (Data-A) is prepared using USGS land Cover Data, DCW streamlines and WBDb-II streamlines.
By using USGS Land Cover Data, the connectivity of streamline data of DCW and WBDb-II is improved and the computer extracted stream line can have some spread of water body like lake and wide rivers.
(2) inland isolated river basins are picked up.
(3) Buffer area ( Area-A) of 5 pixels buffer distance from WBDb-II streamline data is created.
The existing streamlines in DCW and WBDb-II are not always laid on lines extracted by computer. There is inconsistency between existing streamlines and topographic information derived from DEM. Using buffering technique adequate streamline position defined.
(4) Drainage directions (flow direction ) of pixels in Area-A is defined. All pixels in Area-A which has connection to ocean must have drainage direction to reach the ocean, solving concave and flat land problem. This solution is not necessary for the inland isolated Area-A
(5) Buffer area with 5 pixels distance from DCW streamlines, but without Area-A is created (Area-B). Drainage directions of pixels in Area-B are defined. All pixels in Area-B with connection to ocean or Area-A must have drainage direction to reach ocean or Area- B, solving the problem of concave and flat are. But pixels in inland isolated are not necessary to solve the problems.
(6) Drainage directions for pixels not belonging Area-A nor Area-B are defined. All pixels in this area should have drainage direction to reach ocean, Area-A or Area-B, by solving the problems of concave and flat area.
1. Result & Discussion
Global Drainage Direction Matrix (DDM) with 30 seconds are grid is produces using GTOPO30, DCW streamlines, WBDb-II streamlines and USGS Land Cover Data. The generated DDM and extracted streamlines from the DDM have following characteristics:
(1) The extracted river systems have consistent structur4e with existing streamline data such as DCW and WBDb-II
(2) The extracted streamlines runs adequate position of topographic condition derived from GTOPO30 DEM data.
(3) Inland isolated watersheds are delineated using existing streamlines data of DCW and WBDb-II
(4) The consistency of water body distribution between computer derived and satellite image classified can be seen.
Moreover, the global DDM covering most of the continents is the first product opened on WWW.
And, the developed algorithm and computer program which generated DDM by using DEM and streamline information can be adapted for any scale data, and area, and they can produce a consistent DDM and river network systems based on existing streamlines prepared, independent of the accuracy of DEM.
Acknowledgement
This study is research is funded by "Research for the future" program of Japan Society for promotion of science
References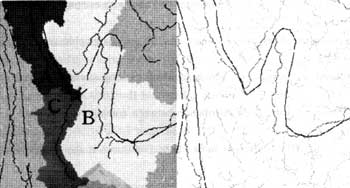
Fig.-1 Wrong Extracted Watersheds(sample)
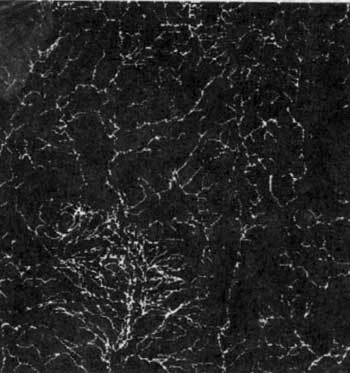
Fig.-2 Existing streamlines in DCW data set
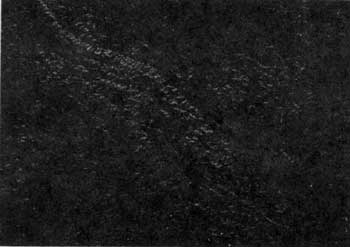
Fig.-3 Computer extracted streamlines with relief shading image
In order to develop hydrological models for flood and water resource analysis of river watersheds continental scale watersheds such as Yangzhy River(China). Mekong River, Brahmaputra/Ganges River, "Drainage Model", which has surface flow direction for each pixel in raster base, is very much required even in rough resolution of 1 km. In this paper, procedure to produce the drainage model is reported. In the first step, method to generate the flow direction using only the GTOPO30-1km digital elevation data-is introduced. However the generated river stream is not match with the stream lines in DCW(Digital chart of the world) and/or classified rivers in the land cover map using NOAA data. In the second step, a method to correct the primary drainage model is introduced, in which DCW and USGS 1 km land cover map is used to make reasonable stream lines. After the drainage model is established, topographical characteristics of watersheds, such as terrain features, land cover distribution and NDVI seasonal changes are analyzed for main rivers in the world. The developed drainage model can be applied to hydrological modeling.
1. Introduction
Drainage Direction Matrix (DDM) is defined as mesh data where each pixel has flow direction showing where the rain and the water body on a mesh flows. By making DDM, boundary of watershed can be delineated, calculation of watersheds area and hydrological analysis based on watersheds will be possible in computer. In order to make DDM, Digital Elevation Model (DEM) is used. If DEM express the detail of the real topography of the land, the flow direction of each pixel can be easily set. However, DEM usually include some error, and it represents a specific heights (ex. Mean Maximum or Minimum Height ) depending the mesh size, so it is difficult to obtain a consistent DDM from DEM.
The problems are the existence of concave pixel which has lowest height among the surrounding 9 pixels and no flow direction, and the existence of flat area where the heights of the neighboring 9 pixels are same. Both of the problems are quite complex and are picked up as subject for many study papers (Hayakawa, 1995, Lu, 1995).
And some solutions are also suggested (Nogami, 1998 ). But even the problems are solved, the computer extracted river systems are not always similar as actual river systems or map extracted river systems. In this case, manual correction comparing the computer products with reliable products are required however it will be difficult if the data size become huge.
In this paper, global DDM excluding Antarctica are produced using GTOPO30-global 30 second are DEM provided by USGS and some other global data sets. A similar products are now available as "HYDRO 1K, Elevation Derivative Database" at USGS which includes data sets of (1) Aspect, (2) Flow Direction , (3) Flow Accumulations (4) Slope (5) Compound Topographic Index. The URL of the site is :
http://edcwww.cr.usgs.gov/landdaac/gtopo30/hydro/index.html
However the available data of "HYDRO-1K" are only two-North America and Africa- and other continents -South America, Asia, Europe ad Australia- are still under the processing (October 1998 ). Furthermore, the algorithm and the accuracy of river network systems are not clear in "HYDRO- 1K" at this moment. This paper describes the detail of the developed algorithm for DDM generation and reliability of the extracted river systems.
2. Used Data
The used data to generate the global DDM are as follows :
GOTO30 30 seconds are Digital Elevation Model of the world lands, provided by USGS. The accuracy of the data is not qualified because the data sources are varied. GOTO30 is one of the precise mesh elevation data covering the entire world land area. The data is also available at following site, and detail of the data can be obtained.
http://edcwww.cr.usgs.gov/landdaac/gtopo30/gtopo30.html
DCW River Data Digital Chart of the world (DCW) includes the world river system (stream line ) data as "DNNET" coverage in LINE feature. Because the data is ARC/Info format, it is converted to 30 seconds grid raster format
WBDb-II River Data world Boundary Databank-II is data sets provided by U.S. Department of state (DoS)/ Central Intelligence Agency (CIA), and it includes the global river system data. Because the data is ARC/Info format, it is converted to 30 seconds grid raster format. The data density is no so high as DCW river data, and it means that river systems in WBDb-II data set are more significant river lines. The data can be obtained from UN/GRID
USGS 1 km Land Cover The data is provided. It is classified image using 1 km 10 days compo9site data from April 1992 to march 1993 combined with other global data sets such as GTOP30 and existing vegetation maps. There are 6 maps provided based on 6 category systems such as 1. Global Ecosystem Legend, 2. IGBP Land Cover Legend , 3. USGS Land Use/Land Cover system Legend, 4. Simple Biosphere Model Legend, 5. Simple Biosphere 2 Model Legend, 6. Biosphere atmosphere Transfer Scheme Legend. In this paper , " 3. USGS Land Use/Land Cover System lend" is used to get information of "water body" distribution which is not described in DCW nor WBDb-II data sets. The data can be obtained from following URL:
http://edcwww.cr.usgs.gov/landdaac/glcc/glcc.html
3. Algorithm
Drainage Direction (flow direction ) is set as the steepest descent direction among the neighboring 8 direction by using DEM. The problem in that the drainage direction can not be set at the concave pixel or flat area as mentioned in above. In order to sole the problem at concave pixel, a method increasing the altitude of the concave point to make over-flow to down stream is suggested and it is well known (Nogami, 1998). And fro flat area problem, some methods are reported to give certain drainage direction for such pixels to reach to bottom of the stream. In our experiences, if the target area covers within a few sheet of 1:50,000 scale map and pixel resolution is not more than 100mX100m, the automated extracted river system are vary similar to the reliable river system information, except flat area where the auto-extracted river line has a controlled direction to the down stream, and the streams do not run along the reliable stream lines in many cases.
In this study, global DDM is produced with 30 seconds are grid (about 1 km resolution at equator ) for lands. At first, DDM was produced by suing only GTOP30, correcting concave and flat area. It is confirmed the most of computer extracted streamlines rum in the bottom of topography ( vally ) whines it overlay with shading image derived from DEM, and most of them run along the streamlines of DCW and WBDb-II data sets within several pixels distortion. However some of the computer extracted streamlines have following problems and the problems make the accuracy of the DDM quite bad in some watersheds.
(1) for example, where three rivers- Yangzhu river, Mekong river and Tanlwin river-run closely at south of China, the computer extracted rivers make wrong watersheds due to the confused DDM. It was easy to detect such wrong river systems because the wrong watersheds are enough big to detect. However similar confusion must be happening in smaller watersheds and they are difficult to detect.
(2) The automated extracted river systems in flat area have artificial controlled direction.
(3) Some watersheds have no outlet to ocean such as rivers in Tibetan Plateau. These Closed water sheds can not be defined by using only DEM.
So there are some but serous differences between computer extracted streamlines and reliable streamlines described in Atlas or existing data sets, and they are difficult to detect and correct by manual work. An algorithm introduced below makes consistent DDM and streamlines using reliable data sets such as DCW, WBDb-II and satellite classified information.
(1) An integrated water body/non water body mask image (Data-A) is prepared using USGS land Cover Data, DCW streamlines and WBDb-II streamlines.
By using USGS Land Cover Data, the connectivity of streamline data of DCW and WBDb-II is improved and the computer extracted stream line can have some spread of water body like lake and wide rivers.
(2) inland isolated river basins are picked up.
(3) Buffer area ( Area-A) of 5 pixels buffer distance from WBDb-II streamline data is created.
The existing streamlines in DCW and WBDb-II are not always laid on lines extracted by computer. There is inconsistency between existing streamlines and topographic information derived from DEM. Using buffering technique adequate streamline position defined.
(4) Drainage directions (flow direction ) of pixels in Area-A is defined. All pixels in Area-A which has connection to ocean must have drainage direction to reach the ocean, solving concave and flat land problem. This solution is not necessary for the inland isolated Area-A
(5) Buffer area with 5 pixels distance from DCW streamlines, but without Area-A is created (Area-B). Drainage directions of pixels in Area-B are defined. All pixels in Area-B with connection to ocean or Area-A must have drainage direction to reach ocean or Area- B, solving the problem of concave and flat are. But pixels in inland isolated are not necessary to solve the problems.
(6) Drainage directions for pixels not belonging Area-A nor Area-B are defined. All pixels in this area should have drainage direction to reach ocean, Area-A or Area-B, by solving the problems of concave and flat area.
1. Result & Discussion
Global Drainage Direction Matrix (DDM) with 30 seconds are grid is produces using GTOPO30, DCW streamlines, WBDb-II streamlines and USGS Land Cover Data. The generated DDM and extracted streamlines from the DDM have following characteristics:
(1) The extracted river systems have consistent structur4e with existing streamline data such as DCW and WBDb-II
(2) The extracted streamlines runs adequate position of topographic condition derived from GTOPO30 DEM data.
(3) Inland isolated watersheds are delineated using existing streamlines data of DCW and WBDb-II
(4) The consistency of water body distribution between computer derived and satellite image classified can be seen.
Moreover, the global DDM covering most of the continents is the first product opened on WWW.
And, the developed algorithm and computer program which generated DDM by using DEM and streamline information can be adapted for any scale data, and area, and they can produce a consistent DDM and river network systems based on existing streamlines prepared, independent of the accuracy of DEM.
Acknowledgement
This study is research is funded by "Research for the future" program of Japan Society for promotion of science
References
- Ayakawa, H. et.al, (1995): study on Extracting Drainage Network from Square-grid DEM, Jr. of hydrological Engineering, vol. 39, pp 121-126
- Lu, M., et.al(1995): Computation of Hydro logically sound Grid -based DEM from contour lines Considering the Position of Valleys and Ridges, vol. 39, pp127-132
- Nogami, M (1998): An Algorithm and a C-Program Source for a Automated Drainage Network Extraction, Theory and Application of GIS (J. of GIS Association of Japan ), vol. 6 No. 1, pp95-102
Fig.-1 Wrong Extracted Watersheds(sample)
Fig.-2 Existing streamlines in DCW data set
Fig.-3 Computer extracted streamlines with relief shading image