| GISdevelopment.net ---> AARS ---> ACRS 1998 ---> Poster Session 3 |
Coregistration and Phase
Coherence: First Steps Towards Complete SAR Interferometry and an
Examination of Suitability for Land Cover Identification in Thailand
W. Jirathana, Robert
Schumann, Kiyoshi Honda, Kaew Nualchawee
Sipace Technology Applications and Research (STAR) Program
Asian Institute of Technology (AIT)
P. O. Box 4, Klong Luang, Pathumthani Thailand 12120
Email: jirathan@ait.ac.th
AbstractSipace Technology Applications and Research (STAR) Program
Asian Institute of Technology (AIT)
P. O. Box 4, Klong Luang, Pathumthani Thailand 12120
Email: jirathan@ait.ac.th
SAR Interferometry of InSAR is the promising technique using additional information from two SAR scenes, the phase difference. This study aim to investigate the initial steps of InSAR processing, coregistration and phase coherence, by means of developing tools. Applying interpolation and correlation algorithm, the coarse coregistration and finer coregistration programs could be developed. Several coregistration parameters such as shifting, rotating and scaling were affected by non-simultaneous of the two SAR acquisitions, however, only shifting parameter was concerned in this research. The coregistration program could achieve the optimal accuracy of 0.1 + 0.05 pixel better accuracy than achieved by GCP's registration approach (0.5 pixel). Additionally, after coregistration of two interferometric SAR images, the coherence image could be formed. The result shown that coherence image derived from ERS-1/2 tandem mission when combining with amplitude data can identify changeable area (vegetation, water) out of the stable (mad-made, bare land) area.
Introduction
One of the distinctive characteristics of Synthetic Aperture Radar (SAR) systems is their capability of recording both amplitude and phase of the backscattered echoes (Prati, el al 1994). The exploitability of amplitude information has contributed variety of applications, for example, forestry, geology, agriculture, hydrology etc. In the last few years, Synthetic Aperture Radar Interferometry or INSAR has become an attractive technique to obtain extra information from SAR images. Not only the amplitude of the signal considered, but its phase as well. In order to use this technique, two SAR images of the same region, acquired with slightly different sensor positions, are used to compute the phase difference of these two data sets. The visualization of these phase difference always called an interferogram
To generate an interferogram applied by particular applications, interferometric SAR images should be processed. Coregistration is the first and is one of the most computationally intensive steps involving millions of pixels. Absolute coherence value derived from complex coherence is a fundamental information of the exploitability of an interferogram. In other words, coherence (complex correlation) between two images is a measure of data quality and the indicator where fringes will be best in an interferogram. In addition, coherence image can be used as hint for image segmentation. It is clarified that by the use of coherence values some ambiguity areas, e.g. vegetated and non-vegetated, which are not clearly differentiate in intensity image can be definitely separated in the coherence image.
In this research, the steps of coregistration and coherence estimation were investigated by means of developing tools. Then the degrees of coherence between the two data sets were determined and finally, suitability of using the derived coherence image for land cover identified was examined.
Test Site and Data Used
Surat Thani province locates 600 km South of Bangkok is the selected test area. Variation of land use types of the test area facilitates the study of using coherence for land cover identification purpose quite well. The ERS SAR scenes used contain mostly flat terrain of Pumduang-Tapi river systems in the center part and high terrain in Western and Eastern parts. Selecting of interferometric data is conditional and demanding depending on the application purposes. For coherence generation purpose, the smallest baseline together with less time interval is preferable. The tandem image-pair with baseline 107 m, applied here therefore is considered suitable.
| Satellite | Product Type | Acquired Date | Orbit | Frame | Bp* in m | Latitude extent | Longitude extent |
| ERS-1 | SAR SLC | 30 Apr 96 | 25056 | 3411 | 187 | 8.32-9.37 | 98.43-99.37 |
| ERS-2 | (Comple Data) | 1 May 96 | 5383 | 3411 | 8.32-9.37 | 98.43-99.37 |
Methods
Coregistration is the first task in interferometric processing. Precise registration of two images at sub-pixel accuracy is required for interferometric use and is achieved by applying since interpolation and correlation. The more interpolation of a pixel, the finer registration can be obtained. Ground Control Point registration combining with interpolation and cross correlation was used for coarse registration. Coherence coregistration was selected for finer coregistration. By this mean, the complex coherence was estimated by equation A. within an image window that of the corresponding area of two interferometric images (slave and master) until the highest coherence is reached.
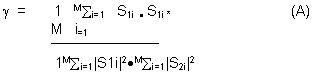
M was the number of pixels involved in the coherence calculation and S1, S2 were the slave and master images respectively.
The programs developed generate coherence image of the two coregistered SAR images. Coherence image was interpreted visually by displaying in color composite. Maximum likelihood supervised classifier was applied for thematic classification, training area were selected according to the land use map 1991 and JERS SAR detected image 1996. The Classified results were investigated and compared to see the affect of coherence on identification.
Results
The results from running the coregistration programs developed in this research indicated that the higher the interpolation time from 2:1 to 10:1 the higher the degrees of the coherence obtained (see table 2). This was based on the fact that the finer the two images were coregistered, the more precise of each scatters within one resolution cell were matched resulting in the phase angle unchanged or consistently changed between the two acquisitions (regardless or temporal changes). Then the two images were considered to be high coherence.
| Area | Interpolation | Average Coherence | S.D. |
| Changeable surface(water, leaves) | 2:1 | 0.31 | 0.175 |
| Stable surface(Build up, bare land) | 2:1 | 0.44 | 0.185 |
| Changeable surface(water, leaves) | 5:1 | 0.32 | 0.178 |
| Stable surface(Build up, bare land) | 5:1 | 0.46 | 0.189 |
| Changeable surface(water, leaves) | 10:1 | 0.32 | 0.179 |
| Stable surface(Build up, bare land) | 10:1 | 0.46 | 0.189 |
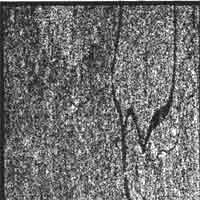
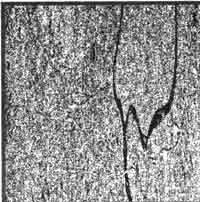
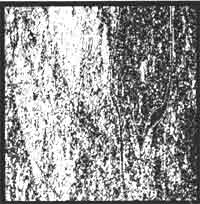
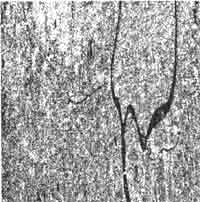
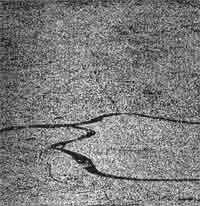
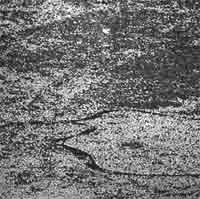
Coherence image derived from tandem data was combined with its amplitude images and displayed in color composite. The visualization of the composite image is shown in figure 2. Interpretation of amplitude image individually could no identify some areas e.g. stable area located left side of the river which is observed as very bright area in coherence image and separated from surrounding changeable areas namely vegetation. Coherence image is a good indicator to identify changeable areas from stable features (unchanged during the two acquisitions). Therefore, vegetated area could be definitely identified from non-vegetated areas. Corresponded results was obtained when carried out supervised classification by including coherence image in the process. The result is depicted in figure 3.
Conclusion
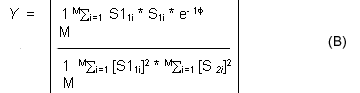
The coregistration program developed in this study could achieve the optimal accuracy of 0.1 + 0.05 pixel better accuracy than achieved by GCP's registration approach (0.5 pixel). However, capability of the programs on amount of data to be processed might be constrained by the computer system configuration. Coherence that calculate from a fine coregistered image pair is considered to be a useful tool to identify stable area (artificial features) out of changeable area (vegetation, water surface). Coherence calculation programs can be improved by include the exponent term in equation (A) as defined in equation (B) (Personal Communication, Homer H., 1998).
References
- Askne J., Smith G., FRINGE 96, Forest InSAR Decorrelation and Classification Properties October 1997. http://www.geounizh.ch/rsl/fringe96/papers/askne/askne.html
- Koshinen, J. ESA-ESRIN, 1995, The ISAR-Interferogram Generator Manual Version 3.0 Italy.
- Massonet D., 1997, Satellite Rader Interferometry, Scientific American February, 1997, May 1998, http://www.sciam.com/0297issue/0297massonet.html
- Prati et al., June 1994, Report on ERS-1 SAR Interferometric Techniques and Applications.
- Samson, J. 1996, Coregistration in SAR Interferometry: MSc Thesis April 1998, http://www.geo.tudelft.nl/fmr/rese..insar/projects/samson.html
 |
 |
 |
 |
 |
 |