| GISdevelopment.net ---> AARS ---> ACRS 1998 ---> Poster Session 3 |
Application of GKSIM Model
for Estimating the Changes of Land Use and Land Cover
Takashi Hoshi1),
Satoshi Hoshino2), Ichiro
Nomura3)
1)Department of Computer and Information Sciences,
Faculty of Engineering, Ibaraki University
4-12-1, Nakanarusawa, Hitachi, Ibaraki, 316-8511, Japan
Tel: (81)-294-38-5133, Fax : 981)-274-37-1429
E-mail : mailto:hoshi@%20cis.ibaraki.ac.jp
2)Faculty of Agriculture, Okayama University
1-1-1, Tsushimanaka, Okayama,700-8530, Japan
Tel: (81)-86-8372, Fax : (81)-86-251-8388,
E-mail : mailto:shoshino@%20cc.okayama-u.ac.jp
3)Graduate School of Science and Engineering, Ibaraki University
4-12-1, Nakanarusawa, Hitachi, Ibaraki,316-0034, Japan
Tel : (81)-294-38-8235, Fax: (81)-294-36-3070,
E-mail : nom@cis01.cis.ibaraki.ac.jp
Abstract 1)Department of Computer and Information Sciences,
Faculty of Engineering, Ibaraki University
4-12-1, Nakanarusawa, Hitachi, Ibaraki, 316-8511, Japan
Tel: (81)-294-38-5133, Fax : 981)-274-37-1429
E-mail : mailto:hoshi@%20cis.ibaraki.ac.jp
2)Faculty of Agriculture, Okayama University
1-1-1, Tsushimanaka, Okayama,700-8530, Japan
Tel: (81)-86-8372, Fax : (81)-86-251-8388,
E-mail : mailto:shoshino@%20cc.okayama-u.ac.jp
3)Graduate School of Science and Engineering, Ibaraki University
4-12-1, Nakanarusawa, Hitachi, Ibaraki,316-0034, Japan
Tel : (81)-294-38-8235, Fax: (81)-294-36-3070,
E-mail : nom@cis01.cis.ibaraki.ac.jp
The changes of land use and land cover show that a region can achieve the continual growth. Therefore it is an important problem to analyze the mechanism of the changes of land use and land cover to develop the long range estimating model to establish the way of the continual development of the global environment. In this study, it is estimated how land use and land cover in Asian region change. It is suggested that GKSIM model is applied to the long range estimating model of land use and land cover. It is one of point modeling method and Korea is applied to this case. This paper describes about the use of GKSIM model, consider how to modify it and report that the political suggestion can be found by the estimated result of land use and land cover.
1.Introduction
GKSIM model is applied to Korea in Asian region to value the long range changes of land use and land cover. Several data which have surveyed every ten years are used, and the changes of land use and land cover area estimated. If these data are used, one of them will have an enormous effect on estimating the changes of land and land cover. We have to make the effort to minimum the error and to use these data and values the changes of land use and land cover until the year 2050.
2. Theoretifcal background of GKSIM model
Generalized Kane's Simulation(GKSIM) model was designed to improve the faults of Kane's Simulation(KSIM) model [ Y.Sawaragi 91981)] and develop it. The summary and features of both models are explained as follows.
2.1 KSIM model
KSIM model is joint simulation model using cross-impact matrix and has the features of geometric model and algerabraic model.
This model is normalized the change variable i of land use and land cover from 0 to 1. The maximum and the minimum values that variable i can change are set. They are set 1 and 0 respectively. These data are transformed into xi ( I=1,2,…,n) that exists in (0,1)interpolation next xi at t+Dt is expressed by Eq.(2.1).
aij(t) is an effect of xj on xi and decided by the specialist usually.
The condition 0<xi(t+Dt)<1 is always assured in Eq.(2.1) because of pi>0 in Eq.(2.2). In other words, it is assured that the estimated value doesn't exceed the limit value.
Though KSIM model is easy to use, it has some faults. For example,
- It is assumed that system variable changes as well as sigmoidal growth curve does. If it changes discontinuously, it can't be used in KSIM model.
- The limit number of variable is defined.
- Though the subjective variable can be used, sometimes there are insufficient cases by the way of using data on the quantitative analysis.
- A few terms can be used.
- Time scale Dt isn't clearly discussed.
GKSIM model has more features than KSIM model does as follows [K. Otsubo (1996-8).
- Applying GKSIM model makes time scale clear.
- Statistical sampling can be done and so on.
Xi(t) is the value in (0,1) transformed the survey data ass well as KSIM model and Eq.(2.4) has been formed.
| xi(t+Dt)=xi(t){1+ri(t)}
={1- xi(t)}1+ri(t) +0{xi(t)} 0 £xi(t) £ 1, 0{xi(k)} ® 0 |
(2.4) |
If parameters Ri and Qi are introduced in Eq.(2.4), Eq.(2.5) is written as follows.
SÅ: The sum of the plus effect on xi(t) SÅThe sum of the minus effect on xi(t)
If Eq.(2.6) is assumed, Eq.(2.7) is written. Cij is an effect of xi on xj.
Ri and Qi are solved by the method of least squares so that Eq.(2.7) may be conformed to the past survey data. Eq.(2.7) is used in GKSIM model.
Past population data, GDP (Gross Domestic Product) data, and these estimated data are necessary to apply GKSIM model to estimating the changes of land use and land cover. If the population in the year 1970,1980,and 1990 are as p(70), p(80), and p(90) respectively, the future population is estimated by Eq.(2.8) and Eq.(2.9).
If p(90)<p(70) andp(70)-p(80)<p(80)-p(90) are, it is estimated by Eq.(2.9) that is a line passing through p(80) and p(90).
| p(t+Dt)= | a ----- p(t) |
+b (2.9) |
As a result, Eq.(2.11) for GDP data as well as Eq.(2.10) is shown. Fig.2.1 and Fig.2.2 show the estimated results respectively.
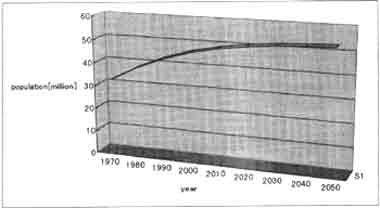
Fig. 2.1 Change of population in Korea
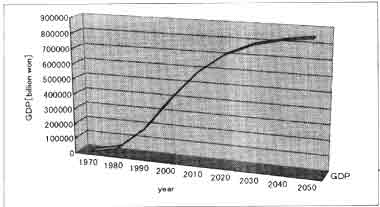
Fig. 2.2 Change of GDP in Korea
3. Application and issues of 3 terms data
Though each data of the same moment are necessary to compare the various countries in Asian region, it is difficult to get them. Futhermore,because GKSIM model required the data at regular intervals, the data of each country in 1970,1980,and 1990 were gathered [1. Nomura (1998.5)].
The changes of land use and land cover in Korea until 2050 as an example are estimated by using land use data and land cover data, and Fig. 3.2 shows Korea in the various Asian countries about the cultivated acreage area. But compared with the data before and after 1970, the only one in 1970 is particularly the low data as the data before the correction in Fig. 3.1 shows. Because we must solve the estimated value by using the data at only 3 moment, in case the data that isn't conformed to the change tendency to the past survey data unexpectedly selected, estimated result can't be got accurately and the estimated result of Fig.3.2 seems to be uncorrected [I.Nomura (1998.10)].
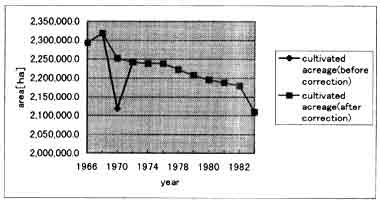
Fig. 3.1 Change of cultivated acreage in Korea
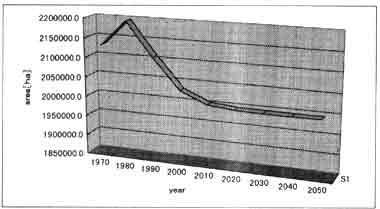
Fig. 3.2 Estimated cultivated acreage in Korea (before correction)
The estimated result may not be correct by using the at regular intervals at this. There are two ways to solve this issue as follows.
- In estimating the changes of land use and land cover, the data in other year is used instead of low data to conform the change tendency of the survey data.
- A regression line is required instead of low data using in other year which is conformed to the change tendency of the survey data, and the data got the regression line is applied to estimating the changes of land use and land cover.
So it is better to use the way of (2). If y and x are assumed the cultivated acreage area and the year respectively, the regression line expressed by Eq.(3.1) is solved by the change tendency of the survey data.
The cultivated acreage area in 1970 can be got by Eq.(3.1), and it that is conformed to the change tendency of the survey data is shown in Fig.3.1. The estimated result of Fig.3.3 can be got using 3 terms data after correction.
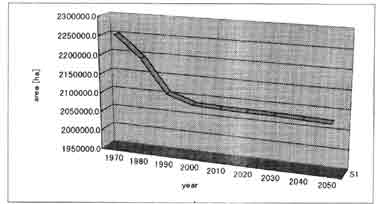
Fig. 3.3 Estimated cultivated acreage in Korea (after correction)
4. Policy goal value
GKSIM model requires the maximum the minimum values that are the limit values to estimate the changes of land use and land cover. The cultivated acreage area inferred from the past survey data in Korea seems to decrease, and it is estimated that the population keeps increasing as shown in Fig.2.1. It is considered that the cultivated acreage area stops decreasing or increases as the policy. If the minimum value is set 1,950,000[ha] as the policy goal value, the policy influences to GKSIM model and Fig.3.2 and Fig.3.3 shown the estimating results are got. These results show that the estimated value is under1,950,000[ha] changes slowly. In other words, if the policy goal value that is inferred from the change tendency of the past survey data as this example is set the maximum or the minimum value, the political element is influence to the estimating result.
5. Results and discussion
In applying GKSIM model to estimating the changes of land use and land cover, some past survey data are used. Input data are the one as follows.
- Some past survey data.
- The limit value of the maximum and the minimum values.
If GKSIM model is applied to a small area as cities, towns, and villages, the estimated result can change largely. The difference of the maximum and the minimum values must be large in such a case.
Also if the difference of the maximum and the minimum values is changed, the changes of land use and land cover on the difficult scale as a country and prefecture or cities, towns, and villages can be estimated and GKSIM simulation on the various condition would be able to carry out. If the policy goal value is set on the maximum and the minimum values, GKSIM and/or KSIM will be used effectly from now to future.
References
- Yoshikazu Sawaragi, Kazuhiko Kawamura : " Joining System Approach ", The Nikkan Kogyo Shimbun, Ltd., pp.181-203,1981.
- K. Otsubo et. al. : "The Long Range Estimation of the Land Use and Land Cover in Asia and the Pacific Area (1), The Study of the Land Use and Land Cover about the global Environment Preservation ", LU/GEC project team. Pp.130-136, 1996.
- K. Otsubo et. al. : " LU/GEC Project Report -the Long Range Estimation of the Land Use and Land Cover in Asia and the Pacific Area (II)-", National Institute for Environmental Studies Environment Agency of Japan Center for global Environmental Research, pp.15-18,1997.
- ] K. Otsubo et. al. : " LU/GEC Project Report -the Long Range Estimation of the Land Use and Land Cover in Asia and the Pacific Area (III)-", National Institute for Environmental Studies Environment Agency of Japan Center for global Environmental Research, pp.86-97,1998.
- Ichiro Nomura, Takashi Hoshi :" Application of GKSIM Model for Estimating the Changes of Land Use and Land Cover in Taiwan and the Indication by GIS ", Annual Conference of JSPRS, L-3, pp.245-248, 1998.5
- Ichiro Nomura, Takashi Hoshi :" Estimation for Change of Land use in Korea Using GKSIM Model ", Annual Conference of JSPRS, H-4, 1998. 10