| GISdevelopment.net ---> AARS ---> ACRS 1998 ---> Poster Session 3 |
The Study on generating of
BRDF table set for Multi Channel Sensor
Asako Konda, Msatoshi
Yokota, Taku Nishijima , Koji Kajiwara, Yoshiaki Honda
Center for Environmental Remote Sensisng (CERES), Chiba University
1-33. Yayoi-Cho , Inage-Ku Chiba 263-8522, Japan
Tel : (81)-43-290-3845 ; Fax : (81)-43-290-3857
E-mail: Konda@rsirc.cr.chiba-u.ac.jp
AbstractCenter for Environmental Remote Sensisng (CERES), Chiba University
1-33. Yayoi-Cho , Inage-Ku Chiba 263-8522, Japan
Tel : (81)-43-290-3845 ; Fax : (81)-43-290-3857
E-mail: Konda@rsirc.cr.chiba-u.ac.jp
We were measuring BRDF (Bi- Directional Reflectance Distribution Factor) for the purpose of multi channel sensor analysis. For that analysis we were measuring used tower (Height is 5m) and 2 stepping motor. In this time, tower was loading a truck, and we became to get a lot of data. In due to measure these study, we could possibly that understood characteristic of grassland BRDF. First step for making BRDF table set for grassland, we discussed Composite Algorithm that avoid effects of BRDF.
1. Introduction
Recently, satellite remote sensing is becoming important engineering for measurement of environmental. However , satellite data are not only information of object, but also including another information of atmosphere, geographic and etceteras. When we used satellite data and analyze, we should remove these informations.
BRDF (Bi- Directional Reflectance Distribution Factor) is in dependent on sun Zenith angle, sun ,sensor azimuth angle, geographic information, and that dependence are different to each sensor dependence of electronic wave. If we get the truth information, we should remove some other information. And BRDF is one of some another information. Usually, we use some MODEL due to express geometry dependence of multi reflectance. But these MODELS are no suitable for using correction and estimation algorithm because these are using some parameter including difficult measurement and calculation, such as distribution of leaves.
2. Objectives
Therefore, in this study, we the measured the ground truth for Mongolia grassland, and analyzed BRDF characteristic. And we development a BRDF table set for correcting satellite data.
3. Observation
3.1 Measurement System
We used measurement system that watanable et al.,1) developed at 1997. (Fig.1) Detail functions are shown the Table.1. And in this study, getting vegetation coverage system is change Digital video camera from 8mm video camera.
3.2 Observation
We carried out an observation the adobe system for the 23rd July to 15th August 1998 in Mongolia. Measurement areas are the three points with different vegetation coverage (Fig.2). Watanabe et al. were that one cycle of measurements every 30 degrees from 0 to 330 degrees for sensor azimuth angle and every 10 degrees from 0 degree to 60 degrees for sensor zenith angle. Total are 75 point measurements. But, by that measurement of large sensor zenith angle is less point than measurement of small sensor zenith angle. Therefore our measurement were following Table.2. Time of one cycle require about 15 minutes. It is more short time than them time because our control PC is more powerful spec than their PC.
| Wavelength | 350-1050nm |
| Spectral Resolution | 0.342nm/ch(2048ch) |
| Integration Time | 0.008-2.04 sec |
| Gain | 1-8 |
| Accumulation Count | 1-255 |
| FOV Angle | 20 deg |
| Quantization Level | 16 bit |
| Sensor Height | 1.5-5m |
| Sensor Azimuth Angle | 0-360 deg |
| Sensor Zenith Angle | 0-70 deg |
| Sensor azimuth angle [deg] | Sensor scan angle [deg] |
| 0,30,60,90,120,150,180,210,240,270,300,330 | 10,20,30,40,45,50,55,60 |
| 10,20,40,50,70,80,100,110,130,140,160,170,190 200,220,230,250,260,280,290,310,320,340,350 |
50,55,60 |
| 0 | 0 |
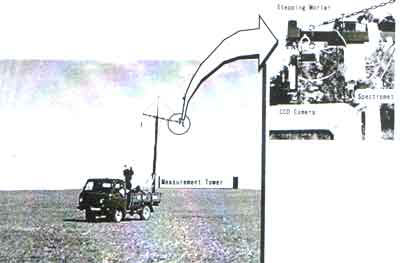
Fig.1 Measurement System
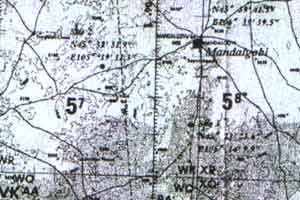
Fig.2 Measurement area
| Time | Date | Count of point | Latitude | Longitude | Vegetation coverage |
| 9:28~19:17 | 98/08/09 | 16 | 46'01.466 | 106'19.935 | 0.15 |
| 11:49~17:23 | 98/08/10 | 11 | 45'36.945 | 105'38.454 | 0.054 |
| 11:16~17:23 | 98/08/11 | 11 | 45'23.300 | 106'14.196 | 0.079 |
4. Results and Conclusion
We could obtain many spectral data in some different geometry condition. Table.2 is data list that we could measure by day and obtain good data for analysis. And these three areas are different of field condition. Following result are measurement data at the 9th Aug (Fig.2).
Results are shown Fig.4-8 Fig.4 and Fig.5 are spectral reflectance characteristics as change the solar zenith angle. As you can see from Fig.3 and Fig.4, the sensor zenith angle is the greater and greater, spectral reflectance is the higher and higher all over the wavelength.
Fig.6 and Fig.7 are depict the 3-D plotting of directional reflectance profiles as change the sensor angle in the red region (580nm-680nm) and in the near infrared region (725nm-920nm) respectively. -y axis indicates the direction of sun (forward scan). +y axis indicate the backward direction (backward scan). Distance from the origin to point on the x-y surface. First, we could understand that directional reflectance profiles differ with sensor angle. And that is different according with wavelength region. In the infrared region is more large effect a change than in red region.
Fig.8 are directional reflectance characteristics as change the sensor scan angle every different the solar zenith angle in the infrared region. When scan angle is -, it indicates forward scan. Backward scan is more large effect a change than scan.
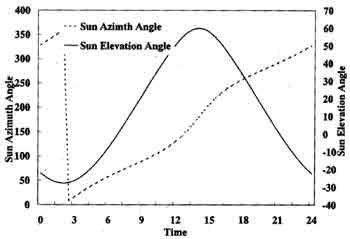
Fig. 3 Measurement Geometric condition
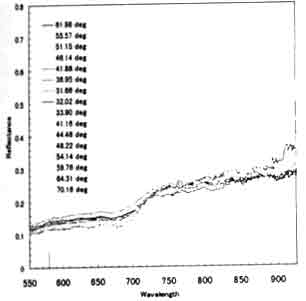
Fig.4 the Spectral Reflectance characteristic (The Sensor Zenith Angle is 0 deg)
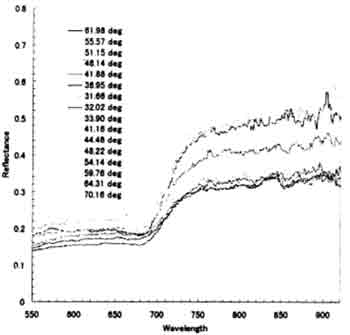
Fig. 5 the Spectral Reflectance Characteristic (The Sensor Zenith Angle is 60 deg)
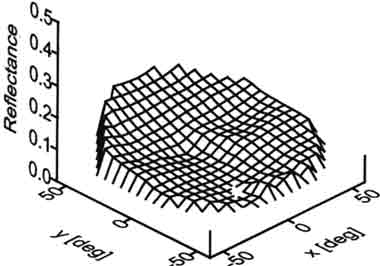
Fig.6 the Directional Reflectance Profile in the RED (580-680nm)
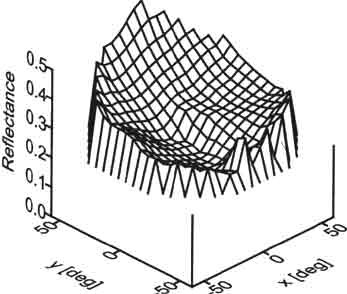
Fig.7 the Directional Reflectance Profile in the RED (725-920nm)
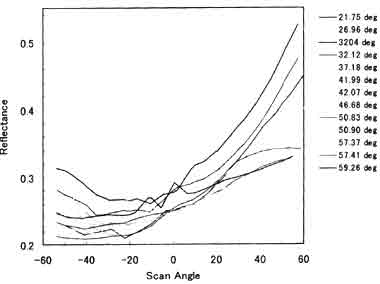
Fig. 8 Directional Reflectance Characteristics
5. Discussion
When we develop composite algorithm that takes BRDF into consideration, we should consider about reflectance characteristics of the following.
- Different with sun zenith angle.
- Different with sun azimuth angle.
- Different with sensor scan angle.
- Different with wavelength.
We thank The local government in Mandalgobi, the Meteorological Center in Mandalgobi and The Ministry for Nature and Environment, the Information and Computer Center.
This work has been supported by CREST (Core Research for Evolutional Science and Technology) of Japan Science and Technology Corporation(JST).
Reference
- Chihiro WATANABE, Yoshiaki HONDA, KAJIWARA The Study of Bi-directional Reflectance Distribution Function (BRDF) for Grassland, ACRS,p-23-1-5,1997