| GISdevelopment.net ---> AARS ---> ACRS 1998 ---> Poster Session 3 |
The study on multi sensors
observing for ground truth using vehicle
Hirokazu Yamamoto, Hiroyuki
Masubuchi, Hironobu Oishi ,Koji Kajiwara and Yoshiaki Honda*
*Center for Environment Remote Sensing (CEReS), Chiba University
1-33 Yayoi-Cho, Inage-Ku, Chiba, 263 Japan
Fax : +81-43-290-3857
E-mail: Kath@rsirc.cr.chiba-u.ac.jp
Abstract*Center for Environment Remote Sensing (CEReS), Chiba University
1-33 Yayoi-Cho, Inage-Ku, Chiba, 263 Japan
Fax : +81-43-290-3857
E-mail: Kath@rsirc.cr.chiba-u.ac.jp
We improved on previous developed ground truth measurement system using vehicle, which can obtained spectral information and ground nadir image with satellite scale in the short time. Our developed new system mounts more various kinds of measurement instruments. We practically tested to obtain data with this measurement system in summer of 1998 in three types of Mongolian grassland. As a result, above-mentioned multi sensors system is very useful instrument for acquisition of data on a satellite spatial scale in the short time and its data is quite useful for satellite data.
1.Introduction
It is focused on monitoring vegetation amount in wide area using satellite data such as NOAA AVHRR. Because thus satellite data that has the characteristics of lower spatial resolution and higher time-frequency is very useful tool in order to monitor the vegetation amount. And it is needed to understand relation between spectral information and vegetation amount. But, in so many studies, ground-based data that is satisfied in comparable with satellite scale is quite few. We aim to standardize the methodology of ground truth for quantitative analysis of vegetation. We already have developed the system using vehicle, and we have confirmed that this system has potential for investigating relationship between spectral information and vegetation coverage ratio (VCR) with satellite scale efficiently. But this system has been able to get only information of spectral reflectance and ground nadir image, and the analysis takes so much time because obtained images have to be captured from 8mm video. If the system can obtained various kind of data and acquire still images, we will be able to investigate relationship between spectral information, VCR and more other ancillary data efficiently.
In this study, we aim to develop the new system which mounted multi-sensor and verify data obtained by this developed system.
2. Study area
The study area is around Mandalgobi in Mongolia (see Fig. 1).We conducted measurement in three types of grassland around Mandalgobi. First observation site, Site 1 is located in north side of Mandalgobi (N450 59' 41.5" E1060 19' 39.5") and this side is more dense vegetated area than other site. Measurement in this site is conducted during 3-9 Aug., 1998 but this report is shown only last measurement day, 9Aug., because this day of weather is best condition for this measurement. Second site, Site 2 is located in western side of Mandalgobi (N450 38' 51.5" E1050 39' 13.3") and this is sparse vegetated grassland area, and data is obtained in Aug. 10,1998. Third site, Site 3 is located in southern side of Mandalgobi (N450 23' 23.6" E1060 14' 9.9") and measurement was conducted 11 Aug., 1998.
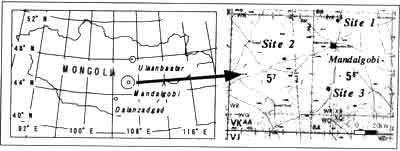
Fig. 1 The study Area
3. Methods
3.1 Multi sensors system
We put on the arm on the car-top and the tip of the arm has multi sensor system . The height of the sensors from ground approximately 2m. This system includes Digital Still Camera (DSC,KONIKA Corp.), CCD Camera (SONY CCD-MC-1) with Digital Video Recorder (SONY DCR-TRV9), GPS Camera (KONICA Corp.), 3D Scanner (PULSTEC INDUSTRIAL CO., LTD TDS3100, 680nm laser scan), thermometer (HORIBA,Ltd., IT-540S), GPS (NovAtel Inc., Single-GPS) and spectometer (Soma Optics Inc). Spectrometer can measures in visible/near infrared between 350nm and 1050nm (measure with 512 ch. mode). This study is shown only spectral reflectance from 520nm to920nm, because the data beyond 520nm -920nm involve noise of this instrument. Thermometer can measure between 8mm and 16mm(1ch).
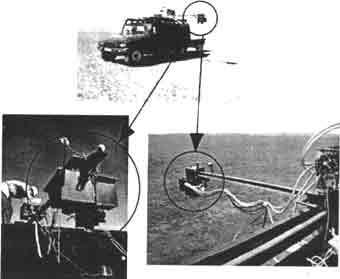
Fig. 2 Mobil Survey System
| Sensor | FOV |
| Spectrometer | Approx. 20° |
| DSC | 48.8° X 37.0° |
| CCD Camera | Approx. 65° |
| Thermometer | Approx. 24° |
| 3D Scanner | 30° X 28° |
Sensors FOV (Fields of View ) of each instrument is shown in Table.1. The directions of view for each sensor are adjusted to parallel. The information of spectrometer, GPS and thermometer are saved as ASCII file and 3D scanner data (distance and laser intensity) and images obtained by DSC are saved as BINARY file on PC. CCD images were recorded with DVC. This system can monitor spectral information are ground condition in the car. DSC and GPS camera is reconstructed to be able to release remote shutter.
3.2 Data analysis
In this study, we analyze spectral information, GPS positioning data, temperature data and vegetation coverage ratio derived from DSC and 3D scanner data. We calculated spectral reflectance from 520nm to 920nm and convolved broad band reflectance in red (580nm-680nm) and near infrared (725nm-920nm) region, and we compared with the spectral property of three types of Mongolian grassland.
This system record only GPS positioning data (x,y,z) but also UTC, standard deviation (x,y,z), GDOP (accuracy), direction and number of satellite in one ASCII file with every spectral information. We confirmed distribution of measurement point and accuracy each measurement points.
Calculation of vegetation coverage ratio is derived from DSC images using RGB pattern method. When we use only this method, it is very difficult to decide threshold value because it is needed trial and error. In this study, at first, we calculated VCR using both of distance data (grass height) and laser intensity data obtained with 3Dscanner, and then we compared with the VCR derived from DSC images and VCR derived from 3D scanner data. We could decide the threshold value.
4. Results and conclusion
We could analyze 100 measurement points in site 1 and site 2 respectively, and 57 measurement points in Site 3. And we could obtain the 100 points data in about 1.5 hours except Site 3. Fig. 3 shows the distribution of measurement points. In case of Site 1,system measured in approx. 2.5km X 2.5km, in case of site 2 and site 3, measured area is approx.1km X 1km area. Standard deviation of Longitude direction is 20m-30m, and latitude direction is 5m-18m. This indicates that these data are comparable with satellite scale. Therefore it is clear that this system measured more various kinds of data in enough wide area in the short time than previous system.
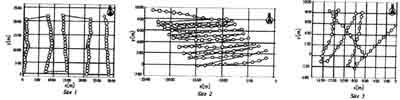
Fig.3 Distribution of measurement points
Fig. 4 depicts distribution of ground temperature measured with thermometer at each measurement points. It is inclined that Site 1, dense vegetation coverage area is lowest temperature but Site 2, sparse vegetation coverage is highest temperature. It is not able to decide to show the effect of vegetation condition because the condition of sunlight is also different in each observation date. It is needed data obtained by fixed point by fixed-point observation in each measurement site.
Fig.5 shows averaged spectral reflectance of each observation site. Difference of vegetation density is appeared more distinctive reflectance in near infrared region than in red region.Fig. 6 shows 2D plot of convolved broad band reflectance in red and near infrared region. This figure is also indicated that difference of reflectance in near infrared is large. Moreover it is appeared that reflectance acquired in Site 2 and Site 3 has similar characteristics of soil reflectance, therefore it is necessary to investigate soil line of each site.
Fig.7 shows example of calculation result of VCR. Right image is original image Obtained by DSC, middle image is VC image derived from distance data (grass height data) and laser intensity data obtained by 3D scanner , left image is VC image calculated with RGB pattern method. RGB pattern method is able to calculate vegetation coverage using digital image lump together. But,in this study threshold is decided by above 3D scanner data. Comparing with original image and processed image, it is clear to acquire proper result. Fig. 8 shows calculated VCR at each measurement point. This figure indicates that more dense vegetated area has larger variable than sparse vegetated area and it could also acquire valid results. But above this method is still needed decision of threshold empirically. Therefore it is necessary to calculate VCR from so many digital images lump together complete automatically.
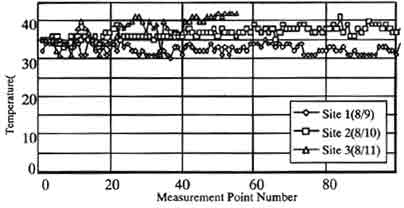
Fig.4 Ground temperature at each measurement points.
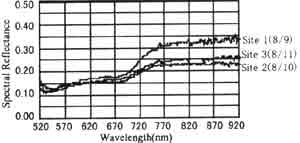
Fig.5 Averaged spectral reflectance in each observation site.
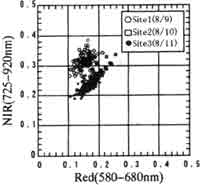
Fig. 6 2D plot of broad band reflectance in red ( 580nm-680nm) versus near infrared (725nm-620nm) region.
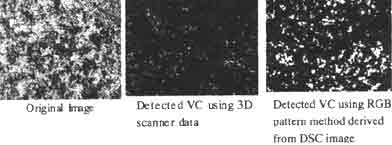
Fig. 7 Example of calculation result of VCR.
5.Discusssion
In this study, we developed new ground truth measurement system mounted multi sensor using vehicle. This system has advantage that most measurement operation can be conducted inside of vehicle. Therefore we could obtain various kinds of so many data in the short time with satellite scale. And we confirmed that data obtained by this system has potential for comparable with satellite data such as NOAA AVHRR.
Analysis after observation become more efficient and easier than previous measurement system because positioning data and the accuracy of GPS and the other information with spectral information is recorded in one ASCII file. We tested to calculate of VCR using 3D Scanner data and DSC image, and we confirmed it is very useful, but it is needed to examine for methodology of calculation of VCR.
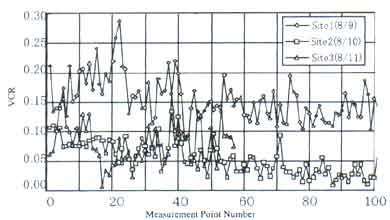
Fig.8 Calculated VCR at each measurement points.
In future, it is thought that biomass data and so on obtained with in the same observation period is analyzed and it is estimated relationship between spectral reflectance and vegetation amount. And it should be also clarified representative value in each site. Moreover we plan to apply the ground-based data obtained by our new developed system to NOAA AVHRR LAC data.
6. Acknowledgements
This work has been supported by CREST (Core Research for Evolutional Science and Technology) of Japan Science and Technology Corporation (JST). And we are very grateful to many staffs of Dundgobi local government and The Information and Computer Center in Mongolia.
References
- Yamamoto, H., Kajiwara, K., Honda, Y.: Car Survey Measurement in Mongolia Grassland, Proceeding of the Symposium of the Japan Society of Photogrammetry and Remote Sensing, 241-244,1995.(in Japanese)
- Yamamoto,H., Kajiwara, K., Honda, Y.: The estimate of Vegetation Coverage Ratio by Car Survey ---- The Experience in Mongolia Grassland ---, Proceeding of the Symposium of the Japan Society of Photogrammetry and Remote Sensing, 241-244,1996.(in Japanese)
- Yamamoto, H., Honda, Y., Kajiwara, K., Okano, C., Huang, S. and Matsuoka, .: The Analysis of Field Data Measured in Grasslandfor Biomass Monitoring Using Satellite Data, Journal of the Japan Society of Photogrammetry and Remote Sensing , Vol.36, No:4, 1997.(in Japanese)