| GISdevelopment.net ---> AARS ---> ACRS 1998 ---> Poster Session 3 |
Monitoring of Forest Fires
And Oil Pollution from Space
Soo Chin Liew, Leong Keong
Kwoh,Oo Kaw Lim Jinguan Lu, Karunakaran Padmanabhan and Hock
Lim
Center For Remote Imaging, Sensing And Processing (CRISP)
National University of Singapore,
Lower Kent Road, Singapore 119260
Tel : (65) 8745069 ; Fax : (65) 7757717,
E-mail: phyliew@nus.edu.sg
Abstract Center For Remote Imaging, Sensing And Processing (CRISP)
National University of Singapore,
Lower Kent Road, Singapore 119260
Tel : (65) 8745069 ; Fax : (65) 7757717,
E-mail: phyliew@nus.edu.sg
High resolution remote sensing from the SPOT, ERS and RADARSAT satellites are being used to routinely monitor land/forest fires and ocean oil pollution in the Southeast Asian region. Burnt scar maps have been generated from missions of SPOT images. In could-covered area. Interfermetric SAR from ERS-1/2 tandem mission are used to complement the optical imagery in assessing burnt areas. ERS and RADARSAT SAR images are useful in detection of oil slicks. A map showing the spatial distribution of oil slicks over Southeast Asian waters have been compiled.
Introduction
Forest fires and ocean oil pollution are two major concerns that affect many countries in Southeast Asia. The 1997/98 forest fires resulted in trans- boundary air pollution in the form of smoke have which has been reported to cause billons in economic loss to the region. The environment effects of forest fires include the loss of biodiversity, loss of forests as carbon sinks and greenhouse grass emission. Several major oil pollution events have also occurred in the region. In this paper we report on the research and monitoring of forest fires and ocean oil pollution using high resolution satellite imagery.
The Centre for remote Imaging Sensing and Processing (CRISP) at the National University of Singapore operates a satellite ground station for reception of images from remote sensing satellite. The reception circle of CRISP's ground station covers the whole of Southeast Asian region. The ground station is currently receiving data from the SPOT ERS and RADARSAT satellite. The high resolution images acquired by these satellite are being used in routine monitoring of forest fires and ocean oil pollution inn the region.
Forest Fires Monitoring
The AVHRR sensors on board the NOAA Polar Orbiting Satellite are conventionally used in monitoring land/forest fires. In particular, the 3.8 mm infrared (band 3) is used in hot spot detection [1,2,3]. The visible band (band1) and the near infrared band (band2) of the same sensors can provide information about the aerosols characteristics and distribution of the smoke have[4].fig. 1shows an AVHARR image acquired in 1 April 1998 over the Borneo island. Smoke plumes can be emerging from the northern coast and drifting to the northwest direction. Fig.2 shows a typical hot spots and smoke have distribution map derived from the AVHRR images. There are well-known limitations on the use of AVHRR images in fire monitoring. The resolution of the images is coarser than 1 km, hence the precise location of the fire spots cannot be determined. Band 3 of the sensor saturates at an effective temperature around 320 K.A pixel can be detected as a hot-spot pixel due to a small but intense fire anywhere within the 1-km2 pixel or by a large extent of warm a land surface. Reflection false alarms radiation from high-albedo land surface, clouds or sea water can also produce false alarms in hot spot detection. Due to these limitations, AVHRR hotspot images tend to overestimate the burnt area but underestimate the number of fires.
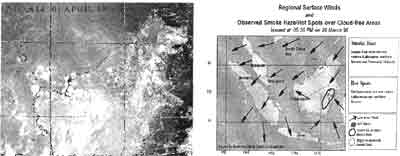
Fig.1(left):AVHRR image (bands1,2,3 composite, shown here in greyscale)of Borneo on 1 April 1998.
Fig 2(right):Hot spots and smoke haze distribution map derived from AVHRR images on 26 March 1998. Hotspots are deteced in East Kalimantan,Sabah and Brunei. (Issued by Meteorological Service Singapore)
CRISP has been commissioned by the Ministry of Environment, Singapore to perform daily fires monitoring over the Southeast Asian region, as a component of the ASEAN haze action plan. Spot images are used to detect smoke plumes, about scars and to establish the locations and extent of the fire affected areas. The processing system has been modified so that full-resolution images can be processed in almost real-tim. A report on the fires detected is pre[ared and transmited to the Ministry of Environment at the end of the day of image acquisition.
A typical SPOT scene of forest fires is shown in Fig.3.This scene was acquired on 15 February,19998, near Samarinda in East Kalimantan. In the visible red band (XS2) image, smoke plumes can be seen as bright strips against a generally dark forest background. Precise locations of the spots can be determined from the source of the plumes in the full-resolution image.The smoke plumes are less visible in the near infrared band (XS3) image but the burnt areas can be readily distinguished as dark patches in this band. Burnt scars can be delineated in the false-color composite SPOT images and regional maps of burnt areas can be generated using mosaics of several SPOT images over the regions of interest [5].These burnt scar maps are valuable assessing damage to the forests land also help in the study of forest regeneration processes. Fig.4 shows an example of a burnt scar map derived from mosaics of 100-m resolution SPOT quicklook images(from July to December 1997) over the southern coast of Kalimantan. For comparison, a cumulative hot spot distribution image derived from daily NOAA-14 AVHRR images(from May to October 1997) is shown in Fig.5.The hot spot distribution derived from NOAA imagery generally agree with the burnt scar maps fro the eastern part of the image. However, the Western part of the image shows an abundance of detected hot spot in Fig.5.but few burnt scars are delineated in the SPOT mosaic (Fig4).This area was covered by clods in the SPOT images acquired during the 1997 fire period. The burnt scar map could be update by using possible cloud-free images acquired after the fire period. However , the forest regeneration process may hinder the use of post-fire image in delineating burnt scars due to the possibility of vegetation regrowth in the burnt areas.
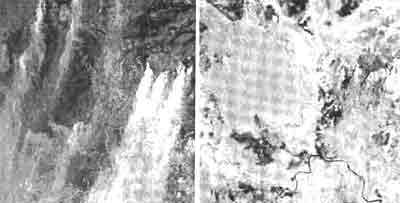
Fig.3: Band XS2 (left)and band XS3 (right) images of a SPOT scene (K302 J350) near Samarindra, East Kalimantan on 15 February,1998.ãCNES 1998.
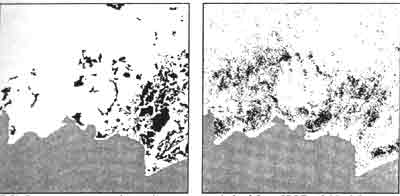
Fig 4 (left): Burnt scar map over the southern coast of Kalimantan derived from SPOT quick look image mosaics (June to December 1997). This map covers a width of about 400 km.
Fig .5(right): cumulative hot spot distribution derived from daily NOAA-14AVHRR images( May to October 1997)
One major limitation of optical/infrared remote sensing imagery lies in the inability of optical / infrared radiation in penetrating clouds and thick haze. It is possible to use the cloud-penetrating Synthetic aperture radar (SAR) to complement optical imagery in mapping of burnt areas. SAR backscatter intensity and interferometric coherence have been used in forest mapping and monitoring [6,7,8]. Tropical forests are known to have a constant backscattering coefficient (so) between -7and -6 dB in C-band SAR. The interferometric coherence of the vegetated areas is typically low compared with the clear cuts or sparsely vegetated areas. If multitemporal SAR data of an area of interest are acquired, clearings of forests/vegetation can be detected by an observed change in so and/or an increase in coherence of the area. Unlike optical/infeaed sensors, SAR is unable to detect hot spots or smoke plumes directly associated with fire. It is thus not able to tell whether the clearings are due to fire or other means. However, if fires have been known to occur in an area of interest, the extent of fire affected areas can be mapping using SAR backscattered intensity and interferometric coherence signatures.
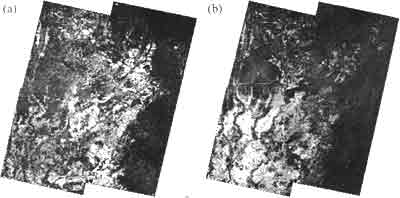
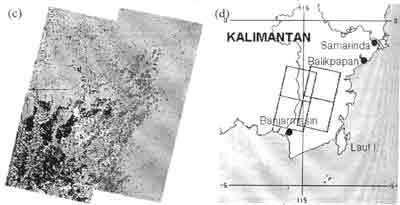
Fig. 6(a) Interferometric coherence map derived from ERS-1/2 tandem data in April 1996.(b) interferometric coherence map derived from ERS-1/2 tandem data in October 1997.(c) burnt scar map derived from the coherence and amplitude data of the two data sets in 1996 and 1997. Black; new clearing, possible affected by fires in 1997, Dark gray: Old clearings with vegetation regrowth. Light gray: Vegetated areas, white: old clearing.(d) Location map of the study area.
Interferometric SAR imagery acquired during the ERS-1/2 tandem missions in April/May1996 and October1997 over the southeast corner of Kalimantan has been used to perform change detection and to delineate areas affected by fires during the 1997 fires. The study area is covered by four ERS scenes of about 100 km cover the study area by 100km each (see Fig.6d for the location). The two coherence maps in 1996 and 1997 are shown in Fig. 6a and 6b respectively while the burnt scar map derived from coherence change is shown in fig. 6c. The possible fire burnt scars are characterized by a low interferometric coherence in 1996 and an increase in coherence between the 1996 and 1997 imagery. About 15%(550kha) of the total area surveyed has been found to be affected by fires. Most of these burnt areas occur in the ERS scene adjacent to the town of Banjarmasin .
Ocean Oil Pollution Monitoring
In ocean pollution monitoring, ERS-2 and RADARAST SAR image are acquired., processed and analysed for detection of oil spills.In SAR images, the brightness of the sea surface is a measure of the sea surface roughness.Smooth sea surface appearsdark while the brightness increases as the sea surface becomes rougher. Oil films are very effective in damping wind-generated gravity-capillary short waves on the sea surface and hence they appear dark against a brighter background in SAR images.However,not all dark sea surface areas in SAR images are oil slicks. Sea surface may also appear dark due to natural slicks, low, sea surface wind speed, and other reasons. Contextual information such as the shapes and locations of the suspected oil slicks can help to avoid false detection. Other auxiliary data such as wind speeds are also helpful if available [9]. Fig. 7 shows two ERS SAR images illustrating oil slicks detected in the Gulf of Thailand and the south china Sea. In the left scene, a slick longer than 100 km runs diagonally across the image.
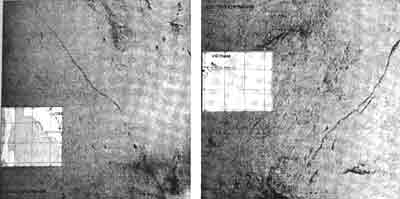
Fig.7: Examples of oil slicks detected in ERS SAR images over the Gulf of Thailand (left) and the south China Sea (right). © ESA 1996.
Statistics of oil-spills over the Straits of Malacca, south China Sea and other seas in the region have been compiled by analyzing over 2500 ERS SAR quicklook images (100-m resolution) of the region in CRISP's archive covering the period from September 1995 to May 1998. A total of 7218 slicks were detected, occurring in 1399 scenes (55% of the scenes surveyed). Most of the slicks were concentrated along the major ship routes. Areas with the most number of slicks per scene were found in the South China Sea and the Gulf of Thailand.
Conclusions
Remote sensing images acquired from satellites provide sypnotic views of the earth surface. Images from the SPOT and ERS satellites have been used in monitoring forest fires and in deriving burnt scar maps for damage assement. Synthetic aperture radar images from the ERS and RADARSAT satellites are useful for monitoring oil pollution in the ocean. Spatial distribution of oil slicks complied from ERS images show that most pollution occurs Along the major ship routes. Examples reported in this paper show that satellite remote sensing can play an important role in the monitoring of land and ocean environment.
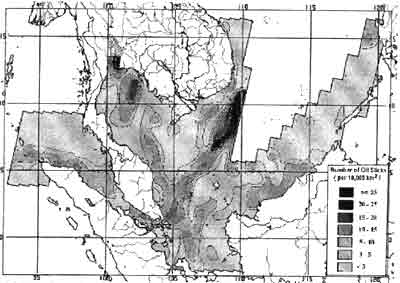
Fig. 8: Spatial distribution of ocean oil pollution in the Southeast Asian waters derived from over 2500 ERS SAR scenes covering the period from September 1995 to May 1998.
Reference
- J.M. Robinson, Fire from space: Global fire evaluation using infrared remote sensing, Int. J. Remote Sensing 12, 3-24, 1991.
- M. Matson, G. Stephens and J. Robinson, fire detection using data from the NOAA-N satellites, Int. J. Remote Sensing 8, 961-970.
- J.P. Malingreau, the contribution of remote sensing to the global monitoring of fires in tropical and subtropical ecosystems, in "Fires in the tropical biota" ed. JD Goldammer, springer-Verllag, 1990, pp. 337-370.
- R.A. Ferrare, R.S. Fraser and Y.J. Kaufman, Satellite measurements of large-scale air pollution: Measurements of forest the smoke, J. Geophys. Res. 95(D7), 9911-9925, 1990.
- S.C. Liew, O.K. Lim, L.K. Kwoh and H.Lim, A Study of the 1997 forest fires in South East Asia using SPOT quicklook mosaics, 1998 Int. Geosci. Remote Sensing Symp.
- T.LeToan, F. Ribbes, T. Hahn, N. Floury and U.R. Wasrin, Use of ERS-1 SAR data for forest monitoring in South Sumattra, Proc. 1996 Int. Geosci. Remote Sensing symp, 842-844, 1996.
- U. Segmuller and C.L. Werner, SAR interferometric signatures of forest, IEEE Trans. Geosci. Remote Sensing 33, 1153-1163, 1995.
- N. Stussi, S.C. Liew, L.K, Kwoh and H. Lim, Landcover classification using ERS-SAR/INSAR data over tropical areas, Proc. 1997 Int. Geosci. Remote Sensing symp. 813-815, 1997.
- H.A. Hovland, J.A. Johannessen and G. Digranes, Slick detection in SAR images, Proc. 1994 Int. Geosci. Remote Sensing Symp., 2038-2040, 1994.