| GISdevelopment.net ---> AARS ---> ACRS 1998 ---> Poster Session 3 |
Updating and application of
DTM on Violent Hill-Slope Land Development
Hain-Hsing Cheng
1, Kai-Huri Lin2 ,Wen-Fu
Chen3
1 Graduate Student Dept. of Soil and Water conservation.,
National chung- hsing Univ., Tai-chung, 402, Taiwan
2 Project Manager of HILTRON TECH, Inc. f3,3 aly,
3 In;# 194 Chung-Shan Rd,Sec.4.Tai- chung,402,Taiwan
3 Professor, Dep. Of Soil and water conservation,
National Chung-Hsing Univ., Tai-chung ,402, Taiwan
Keyword: Digital Terrain Model
(DTM)?Hill-slope Land Development 1 Graduate Student Dept. of Soil and Water conservation.,
National chung- hsing Univ., Tai-chung, 402, Taiwan
2 Project Manager of HILTRON TECH, Inc. f3,3 aly,
3 In;# 194 Chung-Shan Rd,Sec.4.Tai- chung,402,Taiwan
3 Professor, Dep. Of Soil and water conservation,
National Chung-Hsing Univ., Tai-chung ,402, Taiwan
Abstract
Due to violent development of a hill-slope land, there would be tremendous change on terrain and land features. The exited DTM data of that area should be out of date and not be usable because of the changing of terrain. For feature usage of the DTM data after large amount of exploit, the update DTM data is strongly required. Although there are many methods could be used to produce a new DTM data, such as map digitizing, field survey, photogrammetry and remote sensing, those work often takes a lot of expenditure, time and labor. Focusing on a partial change on large area, the traditional methods do not seem to be economical and cannot rapidly achieve new DTM data. The objective of this study is to compare the satellite images of different periods and then modify the major change by manual digitizing. We expatiated hoe we used AutoCAD to readily digitizing the changed area with recent topographic map to achieve the contours. Then ARC/INFO was used to proceed data transform,interpolate,....etc. furthermore, the newly produced DTM data was replaced to that on the changed area to achieve new DTM data. Due to the rapid achievement, this approach can be applied to many fields. In this study we will also introduce some possible applications.
Introduction
Due to rapid economic development and population explosion recently in Taiwan, So for social milieu development required, many of the big non-agriculture hill-slope land violent developing such as esplanade, golf course and freeway etc., there would be tremendous change on terrain and land features. Because of violent change , the DTM data of whole area before developing have not useable in changing part and strongly required of updating to correspond with actually application. There are many methods can produce new DTM data, such as map digitizing, field surveying, photogrammetry and remote sensing etc.(1,2,3,4) ,but they often need to spend a lot of human power and expenditure. Focusing on a partial Change on a large area, the traditional method don't seem to be economical and can't rapidly achieve new DTM data in development area. So this study is to use Arc/Info and AutoCAD that can fist digitizing on computer screen to select the newer photographic base map of development area in watershed. Digitize its contours, boundary and transform the data format. First, update the DTM data in developing area next merge the total area DTM data and complete the new DTM.
Study Area Description
This study area includes Sinpu and Guansi towns of Hsin-Chu County and it is 208 km2 in area. These is a hydrologic observing station at the upstream of Fon-san Watershed. The coordinates of this study area include TM2(E, N)=(255160,2752960)at upper left corner and TM2(E, N)=278800, 2734920) at lower right corner. The elevation is from 48 meters to 1330 meter. Terrance is incised by rivers to become rough and with tributary.
The main stream of Fon-San stream and its tributary- Shau-Li stream are flatter than any other tributaries. Most roads are constructed along the river valleys. This study area are covered by hardwood, Taiwan Acacia forest, grass, tea garden, rice field and naked soil. There are eight Golf courses, Liu-Fu village, Window of China, the 2nd northern freeway and 4 mining fields of limestone. (5)
Selection of the sites
According to 40m-resolution DTM of Taiwan to measure the change of hill- slope land, we can not measure the smaller developed area and variant of volume. Oppositely, apply present precision DTM to detect development of large area hill-slope land and coordinate with remote sensing data which covers large are, have periodicity and are covers to get and establish GIS database to combine GIS and RS detecting big area land use change can be arrived. That's the reason why we choose the developed hill-slope land above the 50-100 hectare, such as golf course, the 2nd northern freeway, mining field and large playground. (5)
Study Material
Satellite images of SPOT,40m- resolution DTM, photographic base map 1/5000 scale, TM2, total 52.
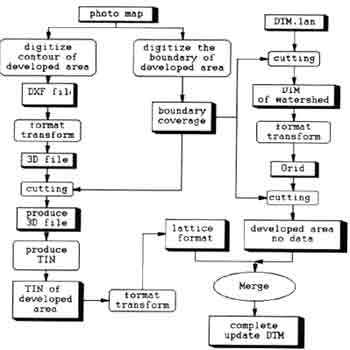
Procedure and methods
1. Watershed DTM Updating after development
The detailed steps and methods is as following:
- Digitize the boundary of the developed area and the contours inside that area.
- Transforming data format
- Getting TIN
- Transforming the data formats of LATTICE and TIN
- Subsetting the DTM of watershed
- Deleting the DTM data of the developed area in the watershed
- Merging
2. Compare the DTM before and after the development
The DTM show tremendous difference before and after the development. It was Shown figure 2 and3.
The differences also shoe in shading method, just as in figure 4 and 5.
The higher the DTM resolution and precision is the greater the difference will be.(6,7,8)
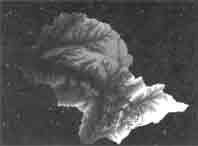 Figure 2. Developed area boundary overlaying DTM |
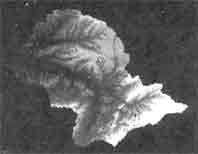 Figure.3 Developed area boundary overlaying updated DTM |
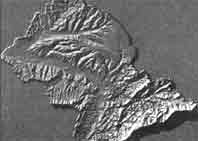 Figure.4 Shaded DTM before development |
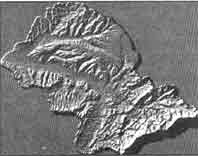 Figure.5 Shaded DTM after development |
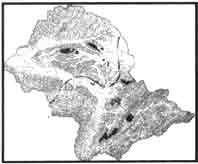 Figure.6 Cut and fill location of full area |
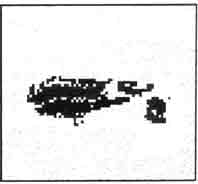 Figure.7 The detailed Cut and fill of Pau-fu Golf Course |
Result Analysis and Discussion
1.Change of Elevation
By overlaying, we can compare the change of elevation of DTM before and after the development. The statistics file of elevation change chart can signify The maximum, minimum, average , and standard deviation of elevation change. Table 2 shown:
| Min | Max | Aver. | Standard deviation |
| -71.991 | 104.583 | -0.007 | 2.421 |
If only is the developed site put into calculation, as table 3 shown:
| Min | Max | Aver. | Standard deviatIon |
| -71.991 | 104.583 | -0.007 | 2.421 |
Unit: meters
Table 3 Elevation change statistics of the Developed area
As table 2 and 3 shows, negative signifies (blue) cut, positive (red) fill and (white) cut-and-fill balance. Table 2 shows the cut depth reaches 71.991 meters, fill height 104.583 meters. It shows clearly the violent situation of cut-and-fill,-the average, -0.393 is that of the total developed site. Negative signifies that cut and fill is not balance, that cut volume is greater than the fill volume.
Table 4 shows the elevation change of the different developed sites. The result is similar to the reality. The total cut depth reaches 32008.1 meters. With a resolution of 40 meters, we can get the total cut volume, that is 51,210,000 cubic meter. And the total fill height is 30060.6 meters. In the same way, we can get the total fill volume,48,090,000 cubic meter. We can conclude that the total soil loss is 3,120,000 cubic meter. From above, the situation of the development in different developed sites and the disturbance site is known easily and quickly.
| Minimum | Maximum | Average | Standard dev. | |
| Full developed area | -71.991 | 104.583 | -0.393 | 17.775 |
| Full watershed | -71.991 | 104.583 | -0.007 | 2.421 |
| Yu-san Lau-yea golf course | -71.991 | 104.583 | 10.488 | 27.258 |
| Pau-Fu golf course | -60.877 | 42.428 | -2.107 | 19.858 |
| Li-Yi goal course | -68 | 44 | -3.449 | 20.280 |
| San-In golf course | -47.309 | 26.057 | 0.015 | 10.495 |
| Lan-In golf course | 3.523 | 28.121 | 16.953 | 5.000 |
| Liou-Fu village recreation site | -20.967 | 11 | -6.564 | 5.355 |
| Siang-Tsoon golf course | -44.866 | 22.751 | -3.492 | 12.099 |
| Free way | -43.042 | 22.162 | -5.635 | 9.889 |
2. Comparison of the physiographic parameter :
(1) Slope
Divide the slope before and after the development into six grades, and Compare the percentages of the gardes. Table 5 shown:
| Slope | Before Development | After Development | Difference % | ||
| Areas(ha) | % | Area(ha) | % | ||
| 0~5% | 3100.96 | 14.53 | 309.56 | 14.50 | -0.03 |
| 5-15% | 3506.40 | 16.43 | 3673.76 | 17.22 | 0.79 |
| 15-30% | 5816.00 | 27.26 | 5847.20 | 27.41 | 0.15 |
| 30-40% | 3485.44 | 16.33 | 3388.00 | 15.88 | -0.45 |
| 40-55% | 3234.40 | 15.16 | 3138.88 | 14.71 | -0.45 |
| Over 55% | 2195.04 | 10.29 | 2192.48 | 10.28 | -0.01 |
The table demonstrates there is a striking slope increase in Grade 2 and a lesser increase in grade 3.There two grades increase 19.3%, and Grade 4 and grade 5 reduce to 9.24%. There is striking reduction in them. But the changes in Grade 1 and Grade 6 are slight. This demonstrates that the cut-and-fill turn steep slopes into flat plain with connect to mining field, playground and highway and the construction of numerous golf courses. especially, the result is greatly influenced by the regulation that the golf course slope is limited to 15%.
1.Aspect
Divide into 9 grades the aspects before and after the development. Table 6 shown:
| Aspect Grade | Before Development | After Development | Difference% | ||
| Area(ha) | % | Area(ha) | % | ||
| N | 2691.20 | 12.81 | 2685.28 | 12.78 | -0.03 |
| NE | 2043.52 | 9.73 | 2046.08 | 9.74 | 0.01 |
| E | 1865.12 | 8.88 | 1855.52 | 8.83 | -0.05 |
| SE | 2436.80 | 11.60 | 2456.96 | 11.70 | 0.10 |
| E | 2856.80 | 13.60 | 2888.48 | 13.75 | 0.15 |
| SW | 2720.64 | 12.95 | 2726.08 | 12.97 | 0.02 |
| W | 2414.24 | 12.92 | 2688.16 | 12.79 | -0.13 |
| NW | 3011.68 | 14.34 | 2989.12 | 14.23 | -0.11 |
| Flat Land | 668.00 | 3.18 | 677.12 | 3.22 | 0.04 |
According to the changes of the aspect, after the development there are striking increases in southeast and south aspects and striking decreases in west and northwest once. The rest change less. The result is related to the fairway direction and weather. Because the south and southeast can avoid the wind in Winter and the sun in summer.
Conclusion
1.By overlaying the established DTM before and after the development, we can know the changes of elevation of the developed areas. Furthermore, we can , from the Changes, calculate and monitor the cut-and-fill volume. Overlaying the contour and DTM can also shows the degree in terrain changes.
2. After analyze DTM of developed areas, we can see the result of monitoring : The maximum cut depth reaches 71.9meters, the total depth 32,008.1 meters the total cut volume 51,210,000 cubic meter, the fill height 104.6 meters, the total height 30060.6 meters, the total fill volume 48,090,000 cubic meter, and soil lost 3,120,000 cubic meter.
3. Integrate RS and GIS proves to be a quick and effective method in monitoring the development of giant hill slope. It can result in the real-time, entirely, and accurate in monitoring certain sites. And also with updating the DTM, the combination can cost less in man power and money.
Reference:
- Tzu-How Chu, Steven-Kuo,1995, Automatic Producing DTM, The Symposium of the First Conference of Chinese GIS Association, pp.7-18.
- Tz-Chung Liu,1994, application of DTM and Remote Sensing on Water Resource Engineering, Training Material of Erdas Inc.
- Chien - Hue Lio, 1995, The Radiation Correction of mountain Area of SPOT Satellite Images, The Symposium of the 14th Surveying conference, pp.389-400.
- Buo-Wen tasi, king-Tasong chang, 1989,The Effect of DEM Resolution on Spatial Interpolation, Remote Sensing (11):pp.29-40
- Hsin-Hsing Cheng, 1996,study of Monitoring on Giant Hill slope Land Development MasterThesis of National Chung-Hasing University.
- Kung-Chung Lai, Wen -Chang Chen, 1994, The Development of Digital Mapping on Agriculture and Firest, Remote Sensing(21):pp.81-100.
- Chien-Yu Jan Liang-Chien Chen, 1994,DTM Generation from SPOT Stereopair Using the Level-9 Product of SRSL, the Symposium of the 13th Surveying Conference, pp.497~504.
- Chen A.J.and J.Y.Chen, 1991 cusing Loutranb an dDEM to derive surface reflectance factor from SPOT HRV data. d IGARSS '91june 3-6 Espoo,Finland,pp.651-654.
- G.Petie, TJM Kennie 1990 ; Terrian Modeling in Surveying and civil engineering ; pp.1~3.
- Kumler,M.P. 1992 An intrusive Comparison of TINS and DEMS, Ph.D Dissertation, Development of Geography Univ. Of Califoenia,Santa Barbara, California, pp. 15~18.
- lay, J.G.1993 ; Experiments on Errors of Digital Elevation Models; GIS/LIS proceedings,1 pp 389~397.