| GISdevelopment.net ---> AARS ---> ACRS 1998 ---> Poster Session 3 |
A Spectral Transformation
Technique for Generating SPOT Natural Color Image
Chi-Farn Chen and Huang-Yi
Tsai
Center for Space and Remote Sensing Research
National Central University
Chung-li, Taiwan
Tel : (886)-3-4227151-7624 FAX: (886)-3-4254908
Email: cfchen@csrsr.ncu.edu.tw
AbstractCenter for Space and Remote Sensing Research
National Central University
Chung-li, Taiwan
Tel : (886)-3-4227151-7624 FAX: (886)-3-4254908
Email: cfchen@csrsr.ncu.edu.tw
Landsat TM and SPOT multispectral satellite images have been widely used in various applications. The spectral and spatial comparisons of Landsat TM and SPOT show that Landsat TM has a broader spectral coverage than SPOT, however, SPOT has a higher ground resolution (20 m) than Landsat TM (30 m). Both satellite images have been commonly used to develop digital techniques for image information extraction. However, the demand of satellite images with natural color and higher spatial resolution has significantly increased recently. It may be due in part to the increasing needs of visual interpretation and display of satellite images. As for the spatial resolution, it seem that the best candidate currently would be the SPOT multispectral image. This research attempts to develop a spectral transformation method to transform a SPOT false color image into a simulated natural color image. The method, which adopts the basic concepts of the geometric transformation, consists of four steps : (1) the selection of spectral control points, (2) the choosing of a transformation function, (3) the finding of the transformation coefficients, and (4) the transformation of the spectral bands of the false color image into the natural color image. The methods have been tested using Landsat TM and SPOT images. The qualitative and comparisons indicate that the striking similarity can be found between SPOT simulated natural color images and Landsat TM natural color images in terms of the visual looks and the correlation coefficients.
Introduction
The images obtained from the Earth resources satellites such as Landsat TM and SPOT have been used for various applications for a long time [1]. These remote sensing images can be characterized as large area coverage, multispectral imaging, multitemporal acquisition, and digital data type. In general, since the volumes of digital data generated by remote sensing systems are enormous, the automated processing of remote sensing data has become a very important task for many applications. Therefore, numerous computer-based analysis techniques have been developed to automatically recognize and extract information from the remote sensing images [2]. Although a lot of effort has been being put continually into the development of automated extraction and recognition techniques, the manual interpretation and image visualization of remote sensing data are still of basic importance for many areas of applications [3]. From a practical point of view, a high-resolution satellite image with natural composite color could be the most comfortable combination for conventional interpretation and visualization for human eyes. Currently, both Landsat TM and SPOT are able to provide high spatial resolution and multispectral data [4]. The spectral bands of Landsat TM covers visible, near-infrared, mid-infrared, and thermal infrared wavelength bands, while SPOT covers only two of visible bands (green and red) and one near-infrared band. As a result, Landsat TM can produce both natural color (visible bands) and false color (combination of visible and infrared bands) composite images and SPOT can only produces a false color composite image [5]. However, Landsat TM presents a relatively lower resolution (30m) image than SPOT (20m). Consequently, if the visual interpretation needs a high resolution and natural color display, it appears that it has to combine both Landsat TM and SPOT data. This study attempts to use both Landsat TM and SPOT data to generate a simulated natural color composite image. In the study, a spectral transformation method is developed to transform a SPOT false color composite (green, red, and near-IR bands) into a referenced image that is natural color composite (blue, green and red bands) from Landsat TM. The method is similar to the geometric transformation [6] that contains four major steps: (1) the collection of spectral control points, (2) the selection of transformation function, (3) the finding of transformation coefficients and (4) the processing of spectral transformation. The detailed transformation procedures will be described in section 2. The testing data can be found in section 3. The results will be discussed in section 4. Finally, the conclusion remarks re give in section 5.
The Spectral Transformation Method
The transformation method developed here is similar to the commonly used geometric coordinate transformation except that the geometric coordinates are replaced with the spectral bands. In order to perform the coordinate transformation, an arbitrary coordinate system must be able to transform into a pre-defined referenced coordinate system. In this study, the arbitrary coordinate system is SPOT green, red and near-IR bands while the referenced coordinate system is Landsat TM blue, green and red bands.
The collection of spectral control points
The general guidelines to select the control points in the geometric coordinate transformation normally requires that some uniformly distributed control points have their coordinates known in both the arbitrary and the referenced coordinate systems. In this study, the control points are called the spectral control points. Accordingly, the selection of the spectral control points has to follow the general guidelines too. The qualified spectral control points are proposed that some pixels have their values of all spectral bands known in both Landsat TM and SPOT images. Moreover, the qualified pixels must be selected in a way that they can well represent the various land cover types on both Landsat TM and SPOT images. Therefore, both Landsat TM and SPOT images have to be converted to the classification maps at first. This study uses an unsupervised fuzzy c-means classifier to perform the necessary classification. Then the spectral control points are randomly selected from each cluster on both Landsat TM and SPOT classification maps.
The selection of transformation function
After the spectral control points are selected, it is necessary to find a proper transformation function. This study uses a first-order polynomial function to describe the spectral relation between Landsat TM and SPOT images. The transformation functions for all three bands (green, red and near-infrared) of SPOT can be described in the following equations:
BL = aB + bBGS + cBRS + dB+IRS
GL = aG + bGGS + cGRS + dGIRS (1)
RL = aR+ bBGS + cRRS + dBIRS
L : Landsat TM
S: SPOT
B : pixel value of blue
G: pixel value of green band
R: pixel value of red band
IR: pixel value of near-infrared band
aB, bB, cB, dB: transformation coefficients (from SPOT to simulated blue band)
aG, bG, cG, dG: transformation coefficients (from spot to simulated green band)
aR, bR, cR, dR: transformation coefficients (from SPOT to simulated red band)
The finding of transformation coefficients
The coefficients of above equations are used to transform SPOT false color image to Landsat TM natural color image. These transformation coefficients can be obtained by applying the values of spectral control points to a least-squares method. Note that each cluster has to solve its least-squares solution and obtain its own transformation coefficients.
The processing of spectral transformation
The spectral transformation is performed according to equation 2 for every pixel of SPOT image. The equation are modified by the fact that the proportion of a particular land cover cluster of a pixel is reflected in the fuzzy membership values. It is therefore that transformation of any pixel has to include all membership values and their related cluster transformation functions. The exact transformation is described in the following equations.
Bt : pixel value of simulated blue band
Gt: pixel value of simulated green band
Rt : pixel value of simulated red band
k: kth pixel
Uik : membership of cluster I of kth pixel
c: number of clusters
Gs : pixel value of green band of SPOT
Rs : pixel value of Red band of SPOT
IRs : pixel value of IR band of SPOT
aB, bB, cB, dB: transformation coefficients (form SPOT to simulated blue band)
aG, bG, cG, dG: transformation coefficients (form SPOT to simulated green band)
aR, bR, cR, dR: transformation coefficients (form SPOT to simulated red band)
The Data
The images used for testing in this study include one Landsat TM images obtained on October31,1995 and two SPOT images acquired n October 31, 1995 and November 12, 1997, respectively. Landsat TM image is used as the reference image while SPOT images are used as the images to be transferred to the simulated natural color composite. Moreover , two test Ares with various agriculture and forest types are selected for testing different spectral coverage's of the proposed transformation method.
Result
The result are examined visually and quantitatively. The visual result s of test area I and II are demonstrated in Fig .1 fig .2, respectively. In fig.1, the comparison of the referenced Landsat TM images with SPOT images indicates that the simulated natural color images have a very similar look with the natural color images. In terms of the color and tone, it is very difficult to make a significant distinction between the simulated and natural color images . the result of test area II can be found in Fig .2. the visual inspection also indicates that it makes no different look between the simulated and natural color images even test area II has different land cover types from test area I.
The quantitative comparison is carried out by calculating the correlation coefficients between referenced and transformed images . the results of test area I and II can be found in Tables 1 and 2. the results of test area I ( Table 1) indicate that very high correlation coefficients ( above 0.85) cab be found for all three bands. For first SPOT images, which is obtained at the same day as Landsat TM, the correlation coefficients even can reach over 0.90 .however , the correlation coefficients of second SPOT images, which is obtained two year later than Landsat Tm , are all below 0.90 but over 0.85. the visual inspection shows that certain land cover types of second SPOT images has gone through some degree of change during that two year period, and as result, it downgrades the correlating between the referenced and transformed images,. The further analysis also indicates that he correlation coefficients of blue band are well below another two bands ( green and red ). The main reason is that the band components used to transform either green or red band has included the color band of itself, while the transformation of blue band used non of itself. Therefore, lower correlation coefficients of blue band may be due to the absence of blue component during the spectral transformation . table 2 presents the results of test area II. The same conclusion s test areas I can be reached too. The further inspection indicates that two SPOT simulated natural color images have nearly the same order of correlation coefficients , even though two SPOT images were acquired for a span of two years . the visual examination shows that it can hardly detect any significant change in two SPOT images. Perhaps no significant change on both images can explain why two SSPOT images have the same order of correlation coefficient. From the result of the visual comparisons and the quantitative analysis of two test area , it is able to draw the conclusion that the spectral transformation method developed in this study is capable of generating SPOT simulated natural color images.
Conclusion
A spectral transformation method is developed to transform SPOT false color images into simulated natural color images . the method basically uses Landsat Tm true color image as the referenced image to array out the spectral transformation of SPOT images. The simulated images have been compared visually and quantitatively with the referenced images for different images details and variant land cover types. The results indicate that SPOT images cab be spectrally transformed to nearly identical natural color images in terms of he visual effects. Moreover, the high correlation coefficients between the referenced and simulated images also demonstrate the successful application of this spectral transformation method.
Reference
- Schott, J.R., "Remote Sensing : The image Chain Approach ". Oxford University Press 1997.
- Schowengerdt, R.A., " Remote Sensing : Models and Methods for images Processing :, 2nd Edition , Academic Press ,pp.522, 1997.
- Sabins, F. F., " Remote Sensing : Principles and Interpretation :, 2nd edition, W.H. Freeman and Company, 1987.
- Lillesand, T.M., and R.W. Kiefer, " Remote Sensing and Image Interpretation", 3 rd edition, John Wiley & sons, Inc, New York, N. Y. 1995.
- " Manual of Remote Sensing ", 2nd edition, American Society of Photogrammetry, 1983.
- " Manual of Photogrammetry ", 4th Edition, American Society of Photogrammetry, 1980.
| Landsat TM 10/31/95 Spot |
R | G | B |
| SPOT 10/31/95 | 0.950527 | 0.933663 | 0.909607 |
| SPOT 11/12/97 | 0.882877 | 0.850736 | 0.842033 |
| Landsat TM 10/31/95 Spot |
R | G | B |
| SPOT 10/31/95 | 0.954144 | 0.936381 | 0.902888 |
| SPOT 11/12/97 | 0.927175 | 0.920398 | 0.895981 |
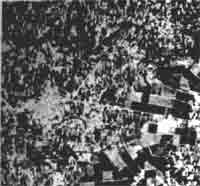 Fig 1(a) |
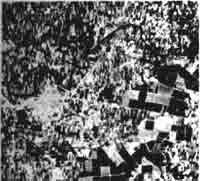 Fig 1(b) |
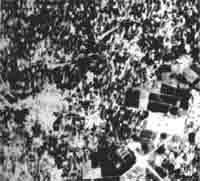 Fig 1(c) |
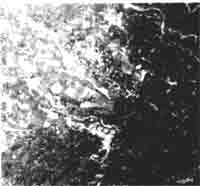 Fig 2(a) |
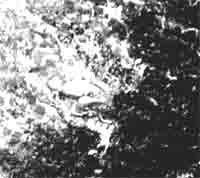 Fig 2(b) |
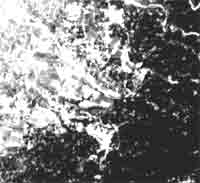 Fig 2(c) |
Figure 1 and 2 Natural color composite and simulated natural color composite of test are I and test area II
(a) Landsat TM (10/31/95) natural color composite
(b) SPOT (10/31/95) simulated natural color composite
(c) SPOT (11/12/97) simulated natural color composite