| GISdevelopment.net ---> AARS ---> ACRS 1998 ---> Poster Session 3 |
Principal Component Analysis
Image for Multi-Resolution Images
S. Phasomkusolsil, N.
Hinsamooth, F. Cheevasuvit, K. Dejhan, S. Mittatha, S. Chitwong, and A.
Somboonkaew*
Faculty o Engineering, King Mongkut's Institute of Technology Ladkrabang
Bangkok 10520, Thailand
*Electro-optics Laboratory, National Electronics and Computer Technology/Center
73/1 NSTDA Building, Ministry of Science Technology and Environment Rama VI
Road, Rajtawee, Bangkok 10400, Thailand
AbstractFaculty o Engineering, King Mongkut's Institute of Technology Ladkrabang
Bangkok 10520, Thailand
*Electro-optics Laboratory, National Electronics and Computer Technology/Center
73/1 NSTDA Building, Ministry of Science Technology and Environment Rama VI
Road, Rajtawee, Bangkok 10400, Thailand
The visual image classification and visual image interpretation can be performed on a colour image which obtained by combining of three different wavelength images of a satellite. However, some images bands are highly correlated. It diminished the efficiency of the mentioned tasks. Also, the different objects can be given high reflectance in difference wavelength of electromagnetic spectral. Therefore, to increase the efficiency of image classification and interpretation, all reflectance information from different spectral band images and satellites are need to collect into a colour image. Then, the simultaneous classification or interpretation for different objects can be effectively done. To create such kinds of images, the principal component analysis (PCA) will be applied to reduce the dimension of image data. Hence, the different spectral images are transformed into some few principal components contained almost the total variance of original images. Nevertheless, each satellite image system provides the different resolution from another. Before applying the principal component analysis, first all images need to rescaling the brightness into the same range. Then, the geometrical error between these images must be corrected by using the second order polynomial. Finally, the biharmonic spline interpolation is used in order to obtain the same resolution of picture element. The result of colour image is obtained by combining the reed, green and blue colors from the first three principle components. This image will contains almost 80 percent of the total variance.
Introduction
Each object on the earth can be well reflected the electromagnetic wave in different wavelength. As we know, more member of non-overlapping wavelength band allows the use to distinguish a larger variety of objects on the earth [1]. Consequently, each satellite for the earth observation is composed of at least three properly selected spectral bands. The colour imager will be obtained by linear combination of three existent image bands from satellite. The colour image is widely user for the visual image classification and the visual interpretation. However, each land observation satellite has its own special proposed. Therefore, sensors of one satellite will be selected the different spectral bands as shown in the table 1.
To increase the efficiency of the image classification and the image interpretation, all reflectance information from different spectral band images of different satellites are then required to collect together. But for visual presentation, all different spectral images cannot show together in the same time. Only three different spectral images can be performed a colour image, since it is produced from three colours which are red, green and blue. Fortunately, they exist a method which can combine almost the total different spectral images into a some fewer imager. This method is known as the principal component analysis (PCA). PCA is the method applied for reducing the dimension of image data. So, all treated images with different spectral are transformed into some few principal components which are preserved almost the total variance of the original image. Nevertheless, the ground sample distance or pixel resolution of one sensor system will be different from another. Hence, an interpolation method is applied to resembling an image in order to obtain the same ground sample distance or pixel resolution. The detail for implementing the PCA of multi-resolution image will be described as the following paragraph.
Preprocessing
Since the images are acquired from different satellites with different pixel resolution, before performing the PCA process, all images must be matched together. The following steps are used as preprocessing before applying the PCA to the considered images.
- Geometric correction The image from each satellite must be
corrected its geometric errors. Also, the geometric correction can be
achieved by using the second order polynomial of mapping function as
shown in the following equations.
u = a0 + a1x + a2y + a3xy+ a4x2 + a5y2 (1a)
v = b0 + b1x +b2y + b3xy+b4x2r+b5y2 (1b)
The (x,y) coordinate is the ground control point obtained from the reference map which the coordinate (u,v) is corresponding ground control point in an image. The coefficients a0 to a5 and b0 to b5 can be solved by the least mean square method.
- Resampling The cubic spline function is quite popular for
interpolation. Here, the ground sample distance will be resample by
using cubic spline interpolation. For a series of given points xi, (I =
0,1,2, ……..,n) which are not equi-space, and the corresponding
functional values are f(xi). For two arbitrary adjacent points xi and
xi+1, the cubic function will be fit to these two points for
interpolating between them. The function can be denoted as [3].
Fi(x) = a0 + a1x+ a2x2 + a3x3 for xi
There are four unknown factors must be solved, but only two conditions are immediately obtained which are Fi(xi) = f(xi) and Fi(xi+1) = f(xi+1). The other two remaining conditions can be chosen by the objective of smoothness. Therefore, the first and second derivative of Fi(x) will be matched to F1-1(x) as shown in the following equations.
F'i(xi) = F'i-1(xi) (3a)
F"i(xi) = F"i-1(xi) (3b)
Since the image has two dimensional functions, the mention process must be applied along the rows of image and then along the columns of the result. The more detail can be read from [3].
- Brightness adjustment All images, the same region but acquired from different satellites, will have different brightness and contrasts. Hence, the transforming function must be applied to readjust the brightness of each image. Then, the brightness adjustment function can be obtained as follows:
Here xi is the old brightness value of a pixel and yi is the new value. Mr and Sr are the mean standard deviation of the reference image, mk and sk are the mean and standard deviation of the kth considered image. - Brightness adjustment All images, the same region but acquired from different satellites, will have different brightness and contrasts. Hence, the transforming function must be applied to readjust the brightness of each image. Then, the brightness adjustment function can be obtained as follows:
PCA is a powerful method of analyzing correlated multidimensional data [4]. The data from all of the spectral bands involve a certain degree redundancy [5]. Then PCA has been used as a data compression technique for solving the mentioned problem. The principal components are based on the eigenvectors of the covariance the correlation matrix. The variance-covariance matrix Cx can be defined as:
Where X is a given of N-dimensional variables with the mean vector M and p is the number of pixel. Each component and p is the number of pixel. Each component Yi is denote by
Yi = a1iX1 + a2iX2 + a3iX3 +...+ aNiXn (6)
= aiTX
aiT is the transpose of the normalized eigenvectors of the matrix Cx. The whole transformation can be shown as
Y = ATX (7)
where A is the matrix of eigenvectors which gives the covariance matrix Cy of Y by
Cy = ACxAT -(8)
The Cy matrix will be a diagonal matrix, which the elements are eigenvalues of Cx
where l1 > l2 >l3 > lN
Result
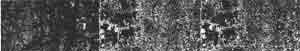
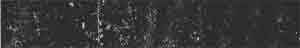
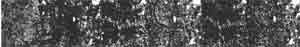
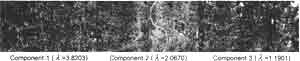
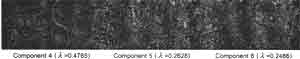
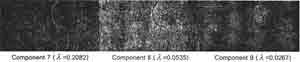
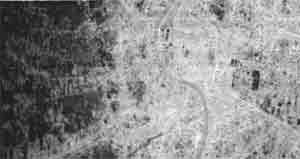
The experimental result is obtained by using three different satellites. They are MOS1, ADEOS and JERS1 with the resolution of 50 m x 50m, 16 m and 16m and 18 m x 24 m respectively. Three images from each satellite are used in the proposed process where the image from ADEOS will be use as the reference image. The result from preprocessing of these nine images can be shown as the Fig. 1. After the PCA process, the nine components can be presented in the Fig. 2. By assigning the colour red, green and blue to the first three principal component respectively, the obtained colour image is shown in Fig. 3. This colour image is contained almost 85 percent of the total variane.
 |
 |
 |
 |
 |
 |
 |
Conclusion
The proposed method is performed a colour image which can be combined all spectral information from different satellites. Therefore, the obtained colour images will be very useful for image classification and image interpretation.
Acknowledgment
The authors would like to think the National Research Council of Thailand for providing the satellite images and Miss. Janjira Jittaviriyapong for providing the manuscript. Miss Janjira Jittaviriyapong is with the Department of Languages and Ladkrabang, Bangkok, Thailand.
Reference
- V. D. Vaughn and T. S. Wilkinson, "System considerations for multispectral and image compression designs," IEEE Signal Processing Magazine, pp. 19-31, Jan. 1995.
- S. K. Jenson and F. H. Waltz" Principal components analysis and canonical analysis in remote sensing". Proc. Am. Soc. Of Photogrammetry, Falls Church, VA: Am. Soc. Of Photogrammetry, pp. 337-348, 1997.
- R. W. Hornbeck, "Numerical Methods," Printice-Hall, Inc., Englewood Cliffs, New Jerscy, 1995.
- G. F. Byne, P. F. Crapper and K. K. Mayo, " Monitoring land-cover Change by principal component analysis of multitemporal landsat data," Remote Sensing of Environment, Vol. 10, pp. 175-184, 1980.
- T. Fung and E. LeDrew," Application of principal component analysis to Change detection," Photogrammetric Engineering and Remote Sensing, Vol. 53, No. 12, pp. 1649-1658, Dec. 1987.