| GISdevelopment.net ---> AARS ---> ACRS 1998 ---> Poster Session 3 |
Automated Extraction of
Shorelines from Optical and SAR Image
L. C. Chen and C. C.
Shyu
Center for Space and Remote Sensing Research
National Central University
Chung-Li, Taiwan
Tel: (886)-3-4257232, Fax : (886)-3-4254908
E-mail: lcchen@csrsr.ncu.edu.tw
Abstract Center for Space and Remote Sensing Research
National Central University
Chung-Li, Taiwan
Tel: (886)-3-4257232, Fax : (886)-3-4254908
E-mail: lcchen@csrsr.ncu.edu.tw
Coastal zone monitoring is an important task in national development and environmental protection. In which, extraction of shorelines is the fundamental work of necessity. This investigation aims to extract shorelines in an automated way for optical and radar images. The use of images of this investigation comprises two parts, SPOT multispectral images and ERS-1 radar images. The main component of extraction of shorelines include : (1) obtaining a rough separation between the land and water and (2) refinement the rough land-water boundaries by edge detection and edge tracing algorithms to extract the accurate shoreline position. To assess the accuracy of shoreline position extracted automatically from the imagery, ground measurements by GPS were treated as references. The shoreline positions determined from the images were found to agree with the measured ground position to within 1.5 pixels.
Introduction
The major difficulty in extraction of shorelines is due to the dynamic behavior of water-land boundaries which vary according to the time-dependent tidal elevations. Thus, the intertwined effect between time and space makes the analysis difficult. Satellites are with high speed moving characteristics. Thus, images acquired from space may freeze time to a certain extent to overcome the dynamic phenomenon for better analysis. Optical images take advantages of being easily interpretated and higher availability. Thus, a number of investigations have been reported on the shoreline extraction in optical images (Frihy et. al, 1994). On the other hand, Rynthetic Aperture Radars (SARs) are all-weather sensors. The data acquisition is not limited to the daytime. Thus, combining optical and SAR images will provide a sound basis for analyzing the dynamic shoreline behaviors.
Due to its side-looking characteristics, SPOT satellites have high revisit capability for a specific target area. As three SPOT satellites, i.e., SPOT 1,2,4, are deployed and operational they may provide the highest frequency or multi-spectral images among commercial satellites which are currently available. Thus, we select SPOT multi-spectral images in this investigation for optical images. Wang and Koopmans (1993) used near IR images to detect shorelines. In which, profile gradients were analyzed to determine the shoreline. Ryan et. al, [1991] used neural networks to discriminate sea and land areas followed by an edge detection procedure. We propose here a novel approach by combining segmentation and edge detection technique to extract shorelines with high precision.
We use ERS images to investigate the extraction of shorelines from SAR images. Due to image speckles, those operator of edge detection for optical images are not directly applicable to SAR images [Li and Mitra, 1995]. Mason [1996] detected the boundaries for sand barriers then followed by an edge refinement. In this investigation, we first introduce a filter to reduce speckles. Then, a segmentation of the sand barriers from background is performed. After a fire tune, the shorelines may be precisely detected.
Shoreline Detection from Optical Images
The flowchart of detection shorelines from optical images are shown in fig. 1. The outlines are described as follows
Fig. 1. Flowchart of Extracting Shorelines from optical Images
In the classification stage, we use a traditional unsupervised method, ISODATA (Ball and Hall, 1965]. After the clustering, the sand barriers are selected. After a sequence of processing including binarization, labeling, thinning, and line tracing, we get the boundaries in this stage. The sea-land boundaries may not be accurate. Accordingly, the successive refinement is needed. In the edge detection, we test Cumani's method [Cumani et. al, 1991]. In which, multi-band images are considered. And, edge strength map may be generated.
The next step is to combine the results derived from segmentation and edge detection. The object boundaries extracted from classification are then processed by morphological operation, i. e., dilation and erosion. Then a buffer zones for the boundaries are established. Through an intersection between the buffer zone and the edge strength map are performed. Finally, precision shorelines are extracted by a local maximum tracing for the edges in the area of the boundaries buffers.
Shoreline Detection from SAR Images
The flowchart of detecting shorelines from SAR images are shown in fig 2. The outlines are described follows.
Fig. 2. The Flowchart of Extracting shorelines from SAR Images
We use Hybrid Sigma filter [Alparone et. al. 1995] to remove the speckles. The filter modified the Lee sigma filter [Lee, 1983] by fluctuating the mean value of Gaussian distribution according to the local window. We then calculate the edge gradients to derive edge strength. Then a suppression for local non-maximum is performed followed by line tracing. At this stage, precision edges are derived. However, not all of them are shorelines. Thus, we need the next procedure.
We test ratio edge detector to segment the blocks. The method was proposed by Touzi et al [1988]. In which, the detector compared the edge ratio probability for a pixel and its neighbors to locate the boundary of a block. Then a morphological thinning [Pratt, 1991] and line tracing are applied to complete the skeletonization. After a buffer zoning, we determine the potential shorelines areas. Through an intersection between the areas and the precision edges generated in the previous procedure, precision shorelines are extracted.
Experimental Results
Two areas were tested. The site is called Wai-Sun-Ding (WSD). The second one is Guan-Ying (GY). A SPOT multi-spectral image and an ERS-1 SAR images were included in both sites. For WSD case, we compared the shorelines digitized manually and the one extracted automatically. While, for GY site, we compared the results of GPS measurements with respect to the one from images.
Fig. 3 represents the results of classification from the SPOT image. Fig. 4 is the superimposition of the original image and the extracted precision shorelines. The consistency of the shorelines extracted from the proposed scheme and manual digitization is better than 2% in terms of the area. Fig. 5 illustrates the total edges on the ERS-1 image. Fig 6 shows the precision shorelines on the original ERS-1 image. Again, the consistency between the proposed scheme and manual digitization is better than 2%. Fig 7 represents the results of GY case. In which, the measurements. The RMSE is better than 1 pixel. Fig 8 is for evaluation of SAR results. The bright line is the shorelines from ERS-images. The dark segment is from GPS measurement. The RMSE is 1.5 pixels.
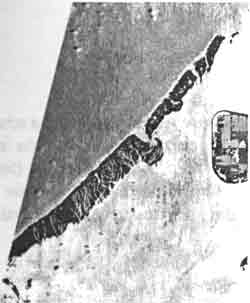
Fig. 3 Results of Classification
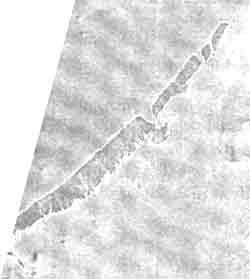
Fig. 4 Precision Shorelines on the SPOT Images.
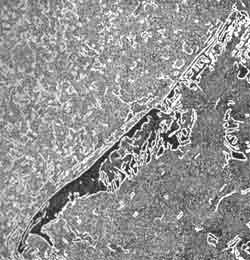
Fig. 5. Total Edges on the SAR Image
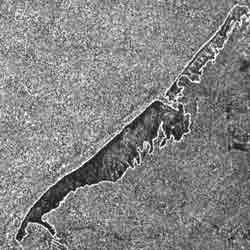
Fig. 6. Precision Shorelines on the SAR Image
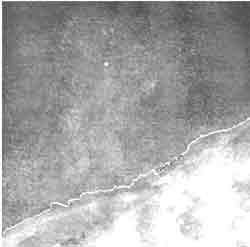
Fig. 7 SPOT Shorelines vs. GPS Measurements
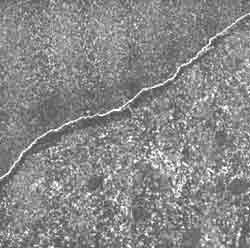
Fig. 8. SAR Shoreline vs. GPS Measurements
Concluding Remarks
Combining the segmentation and edge detection producers, we have proposed a scheme of shoreline extraction for each of SPOT images and SAR images. Experimental results indicate that the accuracy of the extracted shorelines may reach an accuracy of 1.5 pixels (for SAR images) or better (1.0 PIXEL, for SPOT images). Those results provide a sound basis for terrain analysis in the tideland areas when multi-temporal images and tidal measurements are available.
References
- Alparone, L., Baronti, S., and Garzelli, A., 1995, "A Hybrid Sigma Filter for Unbiased and Edge-Preserving Speckle Reduction," IEEE Trans. Eosci. Remote Sensing, pp. 1409-1411.
- Ballard, D. H., and Brown, C. N., Computer Vision, Prenticehall, Englewood Cliffs, NJ, 1982.
- Cumani, A., 1991, "Edge Detection in Multispectral Image", CVGIP: Graphical Models Image Process. 53, pp. 40-51.
- Frihy, O. E., Nasr, S. M., EL Hatlab, M. M., and EL Ray, M., 1994, "Remote Sensing of Beach Erosion along Rosetla Promonotory, Northwestern Nile Delta, Egypt", International Journal of Remote Sensing, Vol. 15,No. 8, pp. 1649-1660.
- Lee, J. S., and I. Jyrkenvich, 1990, "Coastline Detection and Tracing in SAR Images, " IEEE Trans. Geosci. Remote Sensing, Vol. 28, PP. 662-668.
- Li, Hui., Manjunath, B. S., and Mitra, K., 1995, " A Contour-Based Approach to Multisensor Image Registration." IEEE Transaction on Image Processing. Vol. 4, No. 3, pp. 320-334.
- Mason, D. C., 1996, "Accurate and Efficient Determination of the Shoreline in ERS-1 SAR Image", IEEE Transaction on Geoscience and Remote Sensing, Vol. 34, No. 5, pp. 764-773.
- Pratt, W. K., "Digital Image Processing 2nd edition", John Wiley & Sons, Inc., California, 1991.
- Ryan, T. W., Semintilli, P. J., Yuen, P., and Hunt, N. R., 1991, "Extraction of Shoreline Features by Neural Nets and Image Processing", Photogrammetry and Remote Sensing, Vol. 57, No. 7, pp. 947-955.
- Touzi, r., Lopes, A., and Bpousquet, P., 1988, "A Stastical and Geometrical Edge Detector for SAR Images", IEEE Trans. Geosci. Remote Sensing, Vol. 26, pp. 764-773.
- Wang, Y., and Koopmans, B. N., 1993, "The Topographic Mapping of the Tidal Flats Using Remote Sensing and GIS Techniques. A Case Study in the Wadden Sea Area, Netherland". Proceedings of International Symposium of Operationalization of Remote Sensing, pp. 193-203.