| GISdevelopment.net ---> AARS ---> ACRS 1998 ---> Poster Session 3 |
Automatic Detecting Rice
Fields by Using Multitemporal Satellite Images,Land-parcel Data and Domain
Knowledge
Yi-Hsing Tseng,pai-hui hsu
and Huang Chen
Department of Surveying Engineering
National Cheng Kung University
Taiwan, Republic od China
E-mail: tseng@mail.ncku.edu.tw
Keywords: Rice, Inventory, Image
Interpretation, Multitemporal Images, and Temporal Profile.
Department of Surveying Engineering
National Cheng Kung University
Taiwan, Republic od China
E-mail: tseng@mail.ncku.edu.tw
Abstract
A remote- sesing technology for automatically detection rice field is proposed. The principal of this technology is applying a region based classification by means of integrating geographical data and domain knowledge with multitermporal Image. Based on the principal, there methods of investigating the temporal NDVI profile to detect rice fields were implemented. They are profile Matching (PM), peak Detection (PD), and difference classification(DC). All of the methods were tested on a set of Multitemporal SPOT XS images (12 epochs) collected during the second rice season of 1993. comparing to the traditional supervised classification using a single image epoch, all the methods can easily improve the accuracy about 20 %. The PM and PD method. When the number of image epochs is small the PM and PD methods may not work, but the DC method works well even if there are only 2 or 3 epochs. All of the methods do not require any training data for classification. We expect that this approach will dramatically reduce the needs human work and increase the efficiency of the rice inventory work.
Introduction
Inventorying the rice corp. overall the country for each rice season has been an important task of the Taiwan government fro decades. The purposes of carrying on the task are to monitor and control the overall rice product and to provide evidences for the government to compensate farmers when planted crops are damaged by disaters such as typhoons or floods. The current inventory system is founded on a region -based photogrammetric procedure. Aerial photos will first be visually registered onto the corresponding maps of land ownership. Manual photo interpretation is then implemented to determine each land-ownership polygon is a rice field or not. Polygons of rice field will be marked and counted and their areas will be summed to estimate rice product.. this system is developed based on the fact that most boundaries of rice field coincide with the boundaries of land parcel
In order to reduce the cost of the inventory work, using satellite images is suggested to avoid taking aerial photos [Huang,1984]. In this paper, to put into practice, we develop an automatic image interpretation to reduce the need of manual work. The proposed method is a region-based classification by means of integrating land-ownership data domain knowledge with Multitemporal SPOT imagery. The region-based classification is used based on the concept of integrating geographical data and remotely sensed images proposed by Johnsson (1994) and Derenyi & Tuerker (1996)
The consideration of domain knowledge is critical when applying Multitemporal images to image interpretation [Argialas and Harlow.1990]. The knowledge of rice crop including the local crop calender, time table of rice growing, as well as the variations of spectral reflectance within a rice season should be taken into account. Based on the knowledge, the spectral variation derived from a time series of Multitemporal images becomes meaningful and could be used to detect rice field automatically. This idea is similar to the use of temporal profile or temporal differences of spectral properties in image classification proposed by Brisco &Brown [1995],Lo et al.[1986] and Wolter et al. [1995].
The Use of Land-ownership Data
The basic idea of a region-based classification is to determine the region class by means of regional staistic measures of spectral data [Derenyi and Tueker,1996]. The applied images should be segmented into regions, and the spectral means of a region can be calculate for classification [Johansson,1996]. Because the unit of inventory is land parcel, land-ownership data are approprite to defining regions. The classification requires that a single spectral class should dominate each region. In most cases, this requirement can be satisfied, because the boundaries of land parcel mostly coincide with field boundaries and each field usually planted only one kind of crop. The exceptions are usually less then 1% of the total number of field in an agricultural area.
There are two steps to segment a satellite image into region based on the corresponding land-ownership data. First, the image should be registered to the vector data of land-ownership. Second, extracting and storing the spectral data of pixel within each polygon as a data set. In order to determine that in which polygon a pixel locates, one can use the center point of the pixel to perform a point-in-polygon check. This procedure can also avoid that a pixel is assigned to me\ore than one polygon.
The data arrangement mentioned above transforms raster data structure to object-based data structure. All of the data in a data asset are associated with a single region. It is then easier for us to calculate statistic measures of spectral data for each region and to attach the statistic measures to the data set. It is also convenient to add other attribute data further application. Furthermore, such data arrangement is suitable to the integration of remote sensing and geographical information system.
The Use of Domain Knowledge
Discipline specific knowledge including information about spectral, temporal, and structure properties of objects is critical to many inventorying and monitoring works using remote sensing. For rice inventory using remote sensing imagery, the following item are the domain knowledge should be taken into account: the local crop calendar, the time table of rice growing, and the variations of spectral reflectance of a rice field within a rice season
Most rice fields in Taiwan have two planting seasons a year. Each period of rice season is about four mouths. In general, the first season starts in spring and harvests in summer. The second season usually begins right after the end of the first season and harvests before winter is coming. Usually the fields in an agricultural area have similar calendar of planting. However, different agricultural areas may have time differences of rice requirement of using Multitemporal images to detect rice fields.
Basically the whole season of the rice growing can the divided into 5 periods:
- Transplanting: fields are covered by water with little vegetation;
- Growing :fields are getting vegetation entropy;
- Reproducing : vegetation entropy reaches the maximum and starts to decrease slowly;
- Mellowing :vegetation entropy continuously a little;
- Harvesting :fields become bare soil with a little crop residue.
Knowing the timetable of rice growing, a remote-sensing expert would not have difficulties to imagining the variation of spectral reflectance of a rice field within a rice season. The pattern of the temporal spectral variation of a rice field provides solid evidence to identify rice fields. This is the most important reason that we suggest the use of Multitemporal images.
The Use of Multitemporal Images
Using Multitemporal images is helpful inn many application of image interpretation. In this study, the use of Multitemporal images is to increase the potential of differentiating rice field from other land-use types. It should be applied based on the domain knowledge mentioned above. Due to the land-cover variation of rice fields within a planting season, the difficulties can be expected in recognizing rice fields by using a single image epoch. If one uses images taken during the period of transplanting, one would not digtinguish rice fields from wet lands. Similarly, using images of the growing period we may confuse with other vegetation area, and using images taken after harvestinating we will be able to differntiate them from regions of bare soil. However, by investigation the variation of spectral responses of Multitemporal images, we can minimize the possibility of misinterpreting .
Checking temporal variation of sprectral responses has proven effective in agricultural land-cover and forest classification [Lo et al.1995]. Lo et al. analyzed temporal profiles of ratio or green vegetation index to identify crop types. Based on the similar idea, Wolter et.al. utilized temporal NDVI ( Normalized Difference of vegetation Index) differences to distinguish forest types. Therefore the temporal NDVI profile in a rice season investigated. According to the report of Huang et,al. [1985] and some sample data, the temporal NDVI profile of a rice field can be described as in figure 1. Some useful information could be extracted from the temporal profile for distinguishing rice fields, for example the curve shape of the profile or the NDVI differences among epochs.
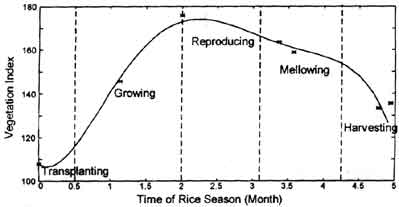
Figure 1. The expected temporal profile of vegetation index in a rice season (the star symbols represent the value of sample data)
The second use of Multitemporal image is decreasing occlusion of cloud. It is in common that images are partially clouded in Taiwan, so that we frequently need to combine more than one image to get a complete visibility. In order to reduce the effect of land-cover changes, the images to be combined should be taken closely in data.
Automatic Detection of Ratio Fields
Three methods were developed to recognized rice fields from SPOT images. They are named profile matching, peak detection, and differences classification.
Profile Matching (PM) An expected temporal profile similar to the curve in the figure1 could be obtained, if an agricultural fields is planted rice. By comparing the expected profile with each temporal profile of the agricultural fields,one could distinguish rice fields from the other agricultural fields. Automatic comparison can be completed by matching the curves using the cross-correlation method (figure2). The threshold value of the cross-correlation function to classify fields into rice and non-rice should determine in advance. Evenly distributive image epochs over the rice season are required to obtain a good result. In addition to detecting rice fields, this method could also determine the planting time of a rice field.
Peak Detection (PD) The temporal profile of the vegetation index in a rice season is a curve of a mountain shape. The peak represents a growing of vegetation in the field. If a peak that locates within a rice season and whose bottom spans about a time period of a rice-growing cycle is detected in the temporal profile of a filed, this field has the evidence of being planted rice. To detect the peak, one can set a horizontal line to intersect with the temporal profile, so that a pair of intersections defines a peak which width and height are estimated as in figure3. There is no rigorous rule to set the NDVI level of the horizontal line. In general, it should be a little bit larger than the NDVI of bare-soil pixel. At least three image epochs those distribute in the beginning, middle, and end of the rice season are required. This method could also roughly determine the planting time of a rice field.
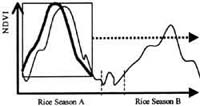 Figure.2 The temporal profile matching using the cross-correlation method. |
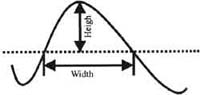 Figure 3.The method of peak detection |
Difference Classification (DC) Instead of checking the shape of the temporal profile, one could also take the NDVI differences between some specific epochs as the features to classify the field. If rice season is equally divided into 3 period. Therefore, the NDVI obtained from an image epoch of the second period minus that of the first or the third periods will provided appropriate NDVI differences fro the classification. The features of such NDVI differences will increase the reparability between the polygon of rice an d non-rice (figure4), so that it improves the classification accuracy. Positive NDVI differences will be obtained if a field is planted rice. Unsupervised classifying the field into two groups, the group has the larger NDVI differences should belong to the class of rice field. At least two images that provide an appropriate NDVI difference are required.
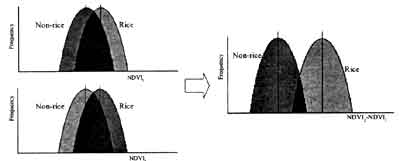
Figure 4. NDVI differences the separability between rice and non-rice fields.
The Study Site
The study site located in Tainan County, Taiwan. It is atypical agricultural area in Taiwan. The area of the study site is about 7.7 km2 . The average size of the agricultural fields is about 3000m2. Rice crops are the major agricultural products in this area. Usually there are more than 70% of the fields being planted rice crops.
Twelve Multitemporal SPOT XS images were studied. The images were selected referring to the local calendar of the second rice season in 1993.The images are shown identification number and the collecting dates in figure 5. The land-cover changes are obviously presented in the time series of images.
The images were selected from the product list of the collected images by the Center for space and Remote Sensing Research, National Central University, Republic of China. All of the images were registered to the land-parcel map of the study area, and were resampled to the resolution of 12.5m by 12.5m pixel size.
The use Multitemporal Landsat Tm images was also considered. However, although Landsat TM images provide better spectral resolution than SPOT image repeatability frequency is generally too low to fit this application
The land-ownership data were digitized from a land-parcel map provided by the crop Bureau of Taiwan. The data contain 2874 polygons of land parcel as figure 6. These data provide us the divide the images into regions with respect to the agricultural fields.
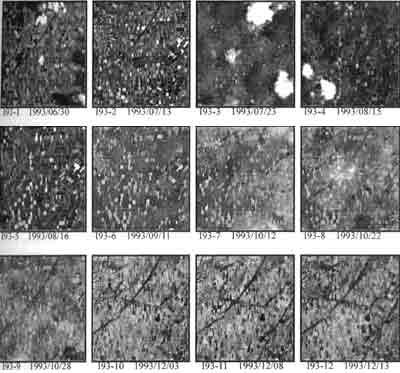
Figure.5 The Multitemporal SPOT-XS images used for the study
The Crop Bureau of Taiwan also provides us data of the ground truth, which will be used to evaluate the results of our experiments. The data were generated by means of manual interpretation of aerial photographs. The data contents are attributes of land parcels that indicate whether a land parcel is a rice field or not. In the second rice season of 1993, there were 2043 rice fields,737 non-rice fields, and 94 mixed fields.
Experiments
A traditional supervised classification using a single image was carried out first provide base of comparison. The test image is 193-6, which was collected when the rice was grown up. Using the maximum-likelihood classifier performed a pixel-based classification. Table 1 shoes the classification accuracy of the two tests. Although using the region-based classification provides higher accuracy than using the pixel-based classification, the both tests reveal the fact that it is inefficient to distinguish rice and non-rice fields by using a single image.
| User's acc.of rice | User's acc.of non-rice | Overall accuracy | K hat | |
| Pixel based | 72.7% | 32.1% | 62.3% | 4.6% |
| Region based | 69.7% | 87.7% | 74.4% | 46.6% |
Then, the proposed methods for detecting rice fields are tested by using the multimporal images of the same test site, and results are shown in table 2 the use images and detection criteria are listed as follows:
- Profile Matching All of the test images were also used to perform matching. The threshold values of the cross-corrrlation function was0.9. The detection accuracy is shown in table 2
- Peak detection All of the test images were also used. The threshold values op the peak height and width for detecting rice fields were 40 and 100(days). The detection accuracy is shown in table 2.
- Difference classification There tests were completed for difference classification with respect to the uses of 2,3 and 4 images. The first test uses the difference of (NDVI193-6 NDV193-2);The second test uses the difference of (NDVI193-6 NDV193-2);and (NDVI193-6 NDV193-10); And the third test uses the difference of (NDVI193-6 NDV193-2); (NDVI193-6 NDV193-10); and (NDVI193-6 NDV193-11). The accuracy was improved when the number of the features of NDVI difference was increased.
| User's acc.of rice | User's acc.of non- rice | Overall accuracy | K hat | |
| PM | 95.3% | 53.3% | 84.1% | 54.4% |
| PD | 79.9% | 83.0% | 80.7% | 70.3% |
| DC(2 images) | 89.8% | 70.7% | 84.7% | 60.7% |
| DC(3 images) | 90.3% | 75.3% | 86.3% | 65.2% |
| DC(4 images) | 91.3% | 76.8% | 87.5% | 67.9% |
The result of the region-based rice detection can be easily put into a geographical information system. A graphical presentation of the detection result and the correctness of detection can be shown as figure 7 by using a GIS tool.
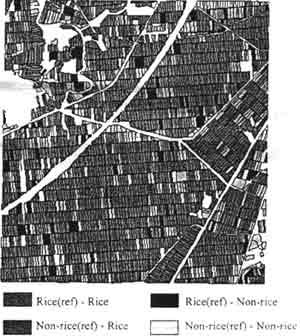
Figure 7. A graphical presentation of the detection results of the DC method using 4 images.
Conclusions
A technology recognition of rice fields by using Multitemporal satellite images is proposed. The principal of this technology is applying a region-based classification by means of integrating geographical data and domain knowledge with Multitemporal Images.. this approach has several advantages in comparing to standard classification approaches:
- The region-based classification directly generates inventory data related to land owners:
- Referring to the domain knowledge, this approach will automatically identify rice fields by using multitemporal satellite images without the need of training data.
- The use of multitemporal images will also increases then classification accuracy.
- The region -based classification is more efficient in computing
The use of Multitemporal images can be extended to check the number of rice season of a year by investigating an annual temporal profile. If the pattern of temporal profile can be liked with other crop knowledge this technology would then be possibly used to recognize various crops. It would also be a very interesting topic that if the temporal relationships are implemented in a knowledge-based classification of satellite images.
Acknowledgments
The authors are appreciated that this research project was sponsored by the National Science Council of the Republic of China under the grants of NSC 86-2221-e006-007. We also would like to thanks the crop Beresu of Taiwan for providing us the test data.
Reference
- [Argialas and Harlow,1990] Argialas, D.P.,and C.A. Harlow,1990. Computational Image Interpretation Models: An Overview and a Perspective, Photogrammetric and Remote Sensing,Vol,56, no6,pp.871-886.
- [Brisco & Brown,1995] Brisci,B and R.J.Brown,1995. Mltidate SAR/TM Synergism for Crop classification in Western Canada , Photogrammetric Engineering and Remote Sensing, Vol 61, no.8,pp. 1009-1112
- [Derenyi & Tuerker,1996]Derenyi E. and M.Tuerker, 1996. polygon Based of remotely sensed images in an Intregrated Geographic Information System ,international and Remote archives o photogrammetry and remote Sensing Vol.31, Part B4, Commission IV,pp.212-215.
- [Huang et.al.,1984] Huang ,T.L.,YL.Liao, and Z.F.Her,1984. The application of Remote Sensing Technologies in the Investigation of Agricultural Resources and Land Use Classification, Agricultural &Forestry Aerial Survey Institute,Taiwan Forestry Bureau Bulletin No.10.
- [Huang et al.,1985] Huang ,T.L.,Y.L.Liao, and S.C.Wang, 1985. Study on the Spectral Characteristics of Rice Crops,Agricultural & Forestry Aerial Survey Institute, Taiwan Forestry Bereau, bulltin No.12.
- [Johansson, 1994] Johansson, K.,1994. Segment-Based Land-Use Clasification from SPOT Satellite Data, Photogrammetirc Engineering and Remote Sensing, Vol.60, No.1,pp.47-53.
- [Johansson, 1996] Johansson, K.,1996. Generalization of Image Data to GIS Polygons for Change Detection and Data Base Revision International Archies of photogrammetry and remote Sensing Vol.31.Part B4,Commission IV,pp,384-389.
- [Lo et al., 1986] Lo,T.H.,F.L.Scarpace, and T.M.Lillesand 1986. Use of Multitemporal Spectral Profile in Agricultural Land-cover Classification, photogrammetric Engineering and Remote Sensing, Vol.52,No.4,pp.535-544.
- [Wolter et al.,1995] Wolter,P.T.,D.J. Mladenoff, G.E.Host, and T.R. Crow,1995. ImprovingForest Classification in the Northern Lake Using Multi-Temporal Landast Imagery, Photogrammetria Engineering and Remote Sensing, Vol.61,No.9,pp.1129-1143.