| GISdevelopment.net ---> AARS ---> ACRS 1998 ---> Poster Session 2 |
Inundation Mapping using time
series RADASART-SAR images In the Lower Making River Basin
Akihiko Imazato*, Atsushi
Rikimaru**, Yasumi Yamaguchi, Takatumi Amano *** and Yoshiaki
Otsubo*
*The Japanese institute of Irrigation and Drainage
** Hoseri Univ.,***Japan Weather Association
*Toranomon NN building, 1-21-17, Toranomon,
Minato-ku, Tokyo,105-0001, JAPAN
Tel : +81-3-3502-1387 , Fax : +81-3-3502-1329
E-mail : akihiko-imazato@jiid.or.jip
Introduction *The Japanese institute of Irrigation and Drainage
** Hoseri Univ.,***Japan Weather Association
*Toranomon NN building, 1-21-17, Toranomon,
Minato-ku, Tokyo,105-0001, JAPAN
Tel : +81-3-3502-1387 , Fax : +81-3-3502-1329
E-mail : akihiko-imazato@jiid.or.jip
It is important for agricultural development to grasp the geographical distribution of inundation that occurs during the rain season every year. Such date is essential for agricultural and rural improving in many countries. The data is used for inundation mapping, which cab be any map that considers agricultural damage caused by inundation. To assess the distribution of inundated fields that may cover a huge area and that may change rapidly; observation from the air is more effective than observation ion the round. Aerial photographs and satellite images captured by optical sensor have been used so far to create inundation maps . however, such optically-captured images do not always provide enough data for analysis s the images are often obscured by the very clouds that cause inundation in the rain season. This study reports on the development of a method for creating inundation maps by means of Synthetic Aperture Radar (SAR). In this method, time series observation using SAR is carried out to provide image of data analysis. These images immediately show inundating conditions in the annual rain season. This study, involving the Lower Mekong River Basin, is part of a program to build a monitoring system for agricultural and rural supporting.
Inundation Mapping using RADASAT-SAR images.
Synthetic Aperture Radar (SAR) can easily detect water surfaces . the microwaves emitted by SAR undergo back-scattering and are reflected like form a mirror when impinging on a water surface =. Microwaves penetrate clouds and reach the round without depending on sunlight. SAR is ideal for observing inundating phenomena that occur frequently during the rain season when there are many clouds. The RADASAT satellite used on this study allows various types of observation by changing the modes of the relevant elements including at beam angle. The user cab specify and observation for any given place under any desired conditions and establish a sequential observation system at intervals as short as two to five days. This interval range is one of the most remarkable features of RADARSAT, compared with J-ERS ad ERS that were typical satellites used before RADARSAT having obsevation intervals of as long as one month or more. These characteristics of the sensor and operating conditions of the RADARSET satellite make RADARSET very useful for acquiring SAR images quick observation of inundating conditions. In this study , SAR study, SAR image taken over several times are subjected to various corrections and overlapped on chronological order, thus creating a inundation map that shows how the inundation changes over time. We also conducted site investigation to verify the validity of the inundation map against actual conditions.
Time series observation and inundating condition.
For agricultural and rural development, it is vitally important assess actual inundating conditions and to define the maximum range on inundated areas. However, defining the maximum range of peak inundated area is not sufficient for determining agricultural damage; it is also necessary to know bow long the corps have remained submerged . that is, including observation should be carried out at three different times as a minimum: 1) the peak tie of inundation, 2) when the inundated area has shrunk to the minimum area and 3) the dry season. Observations in the dry season are used to define the water area heat normally exists throughout the year.
For the investigated area, the correlation between the submerged period due to inundation and agricultural damage is to clear. However, based on ground investigations in advance, we compared the actual agricultural damages and the results of SAR observation. In this comparison, we assumed that the time taken to assess a creation level of agricultural damage and changes of distribution of inundated area is about one week to ten days. After observations at the peak of inundation , we continued to make observations at intervals of the is time span until the inundation shrank to the minimum range . table 1 summarizes the relationship between the SAR observations and agricultural damage.
| Peak of inundation | After 10 days | After 40 days | Dry season | |
| Non-inundated area, undamaged | Non-submerged | Non-submerged | Non-submerged | Non-submerged |
| Short-term inundated area, slightly damaged | submerged | Non-submerged | Non-submerged | Non-submerged |
| Medium-term inundated area, moderately damaged | submerged | submerged | Non-submerged | Non-submerged |
| Long-term inundated area, seriously damaged | submerged | submerged | submerged | Non-submerged |
| Regularly submerged area | submerged | submerged | submerged | Submerged |
inundation mapping through image analysis
The Thabok area near Vientiane in the Lao People's Democratic Republic is selected for the investigating, and acquired observation data over four different times. it is found that peak inundation occurred on August 17 in 1997, and observed 10 days later and again 40 days later in order to track the change in distribution on inundated area as the inundation receded. In addition, we obtained an image acquired in December 1996 to identify the water boundary in the dry season and thus re-create the conditions before inundation occur. These SAR images were processed for each timing of capture and finally combine to from an image, or inundation map (table 2).
| Data of capture | Beam mode | Orbit direction | Situation |
| August 17, 1997 | Wide 1 | Ascending | Occurrence of inundation |
| August 27, 1997 | Standard 5 | Ascending | 10 days after occurrence |
| September 28,1997 | Wide 1 | Ascending | 40 days after occurrence |
| December 20,1997 | Wide 1 | Ascending | Dry season |
Procedure of inundation mapping
- Obtain SAR images .
- Apply geometrical correction to the SAR images so that those taken at different times cab be overlapped.
- Define the submerged area from the SAR images.
- Remove speckle-noise from the identified submerged area.
- Creator a mask of the water area throughout the year from the SAR image taken in the dry season
- Combine the SAR images taken at four different times.
- Conduct site investigation to check whether the inundation map matches actual conditions.
- Conduct site investigation to check whether the inundation map matches actual conditions.
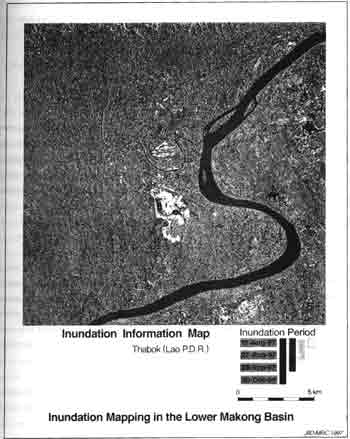
Figure.1 Inundation map basded on times series RADARSAT-SAR images
verificaitn by site investigation
We conducted a series of site investigation at four different times before and after the SAR observations. In the site investigations, we surveyed the actual inundation conditions in the field, and compared the results with the inundation map. The site investigations showed that the actual distribution of t inundated area almost matched the distribution given by the inundation map. However , much of the area was inundated even before August 17 that were considered as the peak of the inundation in this study. We also showed that the inundated area then was larger than that of the peak inundation in august. Therefore, the inundation mapped in this study did not cover all of the inundated area in the investigated area.
Conclusions
We developed a method of assessing the actual conditios of inundatin that occurs frequently in Lower Mekong River Basin by usintg time series RADARSET-SAR images. Ground investigations showed that the inundated area identified by the SAR observations almost matched the actual inundated area at the same timing. However, another large inundation had occurred before we conducted the SAR observation, and we did not succeed in inundation mapping that could cover all the inundated area throughout the rain season.
In future we shall attempt to completely cover the maximum inundated area. we must build a system that allows SAR observations to be conducted promptly after acquiring reliable inundation information from the site itself, and then perform proper analysis.
Acknowledgments
This investigation was made possible with the Expert of the Japan International Cooperation Agency (JICA) in Lao, Mesrs. Hashimoto, Hirodo and Nakai. Thanks are also due to the staff of the Dept. of irrigation, and the Dept. of Hydro-meteorology, of the Ministry of Agriculture and Forestry of the Laotian Government, and the Mekong River Commission.
Reference:
- IMAZATO, Akihiko, RIKIMARU, Atsushi, et al. (1988): "Geographical correction for satellite images by matching path data obtained through mobile GPS observation," Japan Society of Photogrammetry and Remote Sensing, Papers for lectures in academic year 1998, pp. 195-198, 1998 ( in Japanese ).