| GISdevelopment.net ---> AARS ---> ACRS 1998 ---> Poster Session 2 |
Expression of Qualitative and
Quantitative Information on Mangrove Forest in Okinawa
Munetake Kanetomi*,
Kazuhiro Sto** and Takahisa Yamauchi*
* : Air-Graph Co. Ltd., Kamiigusa 1749-1, Kawashima,
Hiki, Saitama 350-0152, Japan
Tel: 81-492-97-7410, Fax: 81-492-97-7414
**: College of Agriculture, University of the Ryukus,
Senbaru 1, Nishihara, Okinawa 903-0129, Japan
Tel: 81-98-895-8792, Fax: 81-98-895-8734
Abstract* : Air-Graph Co. Ltd., Kamiigusa 1749-1, Kawashima,
Hiki, Saitama 350-0152, Japan
Tel: 81-492-97-7410, Fax: 81-492-97-7414
**: College of Agriculture, University of the Ryukus,
Senbaru 1, Nishihara, Okinawa 903-0129, Japan
Tel: 81-98-895-8792, Fax: 81-98-895-8734
Qualitative and quantitative simultaneously expressed map ought to be more useful for forest management. The way to put this matter into practice using remote sensing was examined for mangrove forest in Okinawa.
Two kind of information were expressed as imagery. Patterns composed with black marks were used for smaller number of classes and colors were used for larger number of classes. In this paper, qualitative classification as species and mixture ratio was expressed by patterns and quantitative classification as stand stock was done by colors. In this case of that one dot corresponded to one pixel, problem were remained.
Introduction
We have examined qualitative and quantitative simultaneous expression of information on mangrove forest using remote sensing technics4.5. It is assumed that qualitative information are forest type, operation type, species, mixture ratio and so on, and quantitative information are height, diameter at breast height (DBH) and stand stock or biomass. Some classifications are useful for qualitative classification and regression analysis is useful for quantitative estimation. One of the authors and other coresearchers reported relationship among TM data of landsat 5 and stand parameters on mangrove forest1, 2, 3). Although simultaneous expression with colored qualitative classification and isopleth figure of estimated quantitative stand parameter was suggested in the reports, systematic drawing of the isopleth figure is not completed yet.
We tried to express qualitative classification as patterns composed with black marks. It is easier to make pattern correspond to a qualitative class rather than to quantitative class because number of classes is usually smaller. It is possible to express quantitative classes as considerable many colored classes. So monochrome patterns were overlaid on the colored classification imagery.
Method
A mark can be expressed only one as a point by a dot on a CRT. It becomes easier to make many marks increasing number of dots. A square corresponded to a pixel is composed on a CRT by dots. The size must be same for both information because one is overlaid to another on a CRT. We fixed the size as five dots for a pixel because of clearness of pattern, ease to make marks and extent of background. Simple and clear examples of mark composed with five by five dots were shown in Fig.-1.
Fig.-1 Simple and clear examples of mark composed with5 by 5 dots
For this examination, we used a set of TM data without band 6 of Landsat 5 acquired on 16 May 1994 as a scene of path 115 and row 43. So the square on a CRT corresponded to pixel equivalent to extent of 30m by 30m. Extensive area can be displayed as imagery with smaller squares on a CRT and displayed area become narrower with larger squares. So the size must be decided harmoniously two conditions of clearness and extent displayed imagery.
a) Preparation of data sets
A mask procedure suggested by us4, 5) was applied for the preparation of data sets of each band. The mask was made with binary imagery of band 4 and 5. The threshold values were decided from CCT counts along boundary between waters and mangrove area or mangrove area and land area. This mark was composed with Zero inside mangrove area and 255 outside it. From this procedure mangrove area was identified. It becomes possible to produce data sets to hold actual data only inside mangrove area by subtraction of this mask between each band data. These procedure data were used for estimation of stand parameters and classification of mangrove species.
b) Estimation of stand parameters as quantitative information
Relationship between TM data of Landsat or many calculated indexes from them and stand parameters has been examined on mangrove forest in Okinawa1, 2). Additionally similar correlation and regression analysis has been done for mangrove forest in Sumatra, Indonesia3). In these paper, examined stand parameters were tree height, diameter at breast height (DBH), stem volume, crown area stand stock and so on. And it was described that B4, B1/B4, B2/B4, B3/B4, B4/(B3+B1), B4/(B3+B2), B4/(B3+B7), (B4-B1)/(B4+B1), B4-B2)/(B4+B2) and (B4-B3)/(B4+B3) showed significantly high correlation coefficient with some stand parameters. B1, B2, B3, B4, B5 and B7 meaned CCT count of each band of suffixed number.
In this paper, we had quoted following regression equation for estimation of stand stock as quantitative information from the paper mentioned above.
Y = 6.15X - 352.3 (r = 0.878, significant at 0.1 % level)
Where, Y is stand stock (m3/ha) for each pixel
And X is CCT count of band 4
Estimated values were divided to ten ranges and displayed by a colored square on a CRT, but by a monochrome square in this paper. This procedure and printed map is useful to sum up volume of resources and to know distribution of resources. It is possible to estimate also tree height, DBH, stem volume as quantitative information.
c) Classification of species and mixture condition as qualitative information
Although eight species of mangrove in a narrow sense are distributed in Okinawa, the dominant species are Rhizophola stylosa Griff. And Bruguiera gymnorrhiza (L.) Lamk. It is possible to regard mangrove forest composed with these two species on appearances. So one species mixture ratio is difference to subtract another species ratio from 100 %.
Classification of species and mixture condition as qualitative information was done by the maximum likelihood method with band 3, 4, 5 and 7 using field survey data of mixture ratio of R. Stylosa as training data. A pixel over 80 % of the ratio was indicated as R. Stylosa dominated, less than 20 % as B. gymnorrhiza dominated and in between 80 % and 20 % was done as mixed stand by respective marks. Classified result is generally displayed by colored a square. But this result was corresponding to black marks because it had to be overlaid on a colored square corresponded to estimated value for stand stock.
Result and Discussion
Estimated and printed out result as stand stock, classified and printed out result as species and mixed stand were shown in Fig.-2. Overlaid result of qualitative information as patterns to monochrome imagery as quantitative information was shown in Fig.-3. This mangrove forest is relatively smaller and distributed in the mouth of Fukido River in Ishigaki Island. An example of qualitative and quantitative simultaneously expressed imagery of larger mangrove forest along Nakama River in Iriomote Island was shown in Fig.-4. These islands are located in Yaeyama region, southern part in Okinawa.
Although it was hard to see black patterns to indicate species and mixed stand on monochrome background to indicate stand stock, it was easy to see pattern and color of background simultaneously on a colored imagery. So it became possible to know two information on mangrove forest by imagery produced directly through a personal computer system using remote sensing. It was possible to sum up respectively volume of resources for each species by this procedure not only the imagery.
AS data set can be made separately for land area and waters through this mask procedure, classified imagery and composed imagery with RGB also can be made for each category. So the imagery of mangrove forest can be overlaid on classified or composed imagery for categories outside mangrove forest. Such imagery or map and summation of quantitative information are useful for the sustainable control and managements of mangrove forest.
It is difficult to apply this way to the case which one or less than 5 dots correspond to one pixel to display more extensive area on a CRT. Drawing way of isopleth figure must be developed for such circumstances.
We think possibility of that relationship between CCT count of band 4 of Landsat 5 and stand parameters are almost similar region because the level of CCT count relates directly with quantity of tree crown. It is considered that the level naturally relates with other stand parameters through their relation with quantity of crown as photosynthesis organ. We must confirm the matter mentioned above. If regression coefficients between CCT count of band 4 and stand parameters are different among regions, it is possible to make a table of regression coefficient to apply estimation equation for respective regions. So field survey for the relationships between remote sensing data and stand parameters is fundamental and pressing activity for countries distributed mangrove forest.
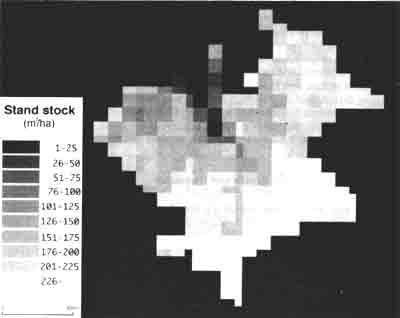
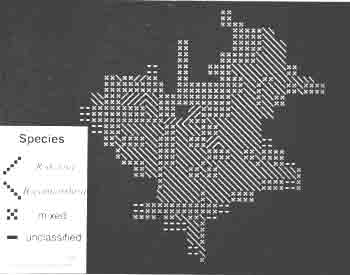
Fig.-2 Two examples of imagery to express estimated stand stock (above) and species and mixture stand distribution (below) for mangrove forest in the river mouth of Fukido River in Ishigaki Island
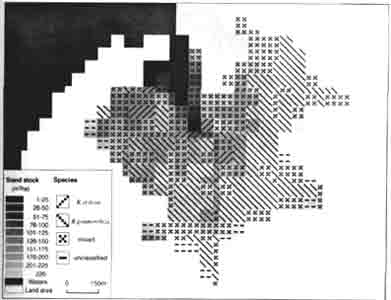
Fig.-3 Example of imagery overlaid below figure to above figure in Fig.-2
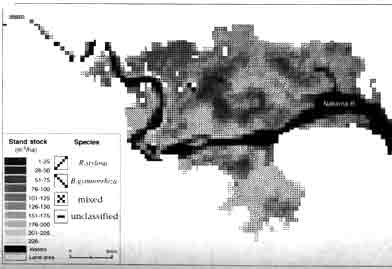
Fig.4 Example of imagery to express simultaneously stand and species and mixedstand for mangrove forest in the river mouth of Nakama River in Iriomote Island
Conclusion
It was successful to some degree the at we tried to develop the way o qualitative and quantitative simultaneous expression for mangrove forest. Although the way do draw isopleths figure on quantitative information is remained, the procedure mentioned above is well useful for actual use. Remained problems are development drawing way of isopleths figure and establishment equation for quantitative information in many regions.
References
- DWI Setyono, sato,K.& khoda, Y.: Relationships between TM Data of Landsat 5 and Stand Parameters on Mangrove Forest in Okinawa, j. Japan Soc . Photogrammetry and Remote Sensing, Vol.36, No.2,4~12,(1997)
- Dwi Setyono, Sata, K. & Khoda, Y.: Relationships between calculated indexes form TM Data of Landsat 5 and Stand Parameters on Mangrove Forest I Okinawa, J. Japan Soc . Photogrammetry and Remote Sensing, Vol. 36, No.3, 6~12, (1997)
- Dwi Setyono: Studies on the system for Stand Analysis of Mangrove Forest using Remote Sensing, Agr. D. Thesisi, Hagoshima University, (1997)
- Sato, k., Nakajima, M.& Hoshi, T.: Mask Procedure for Effective Classification f mangrove Area and a method to Decide Threshold values with TM data of Landsat 5, Proc. Of the 17 th ACRS, WS-1-1~6, (1996)
- Sato, K., Nakajima, M & Hoshi, T.: conception of Qualitative and Quantitative Classification of Mangrove Forest with TM Data of Landsat 5, Proc. Of the 18 th ACRS, G-6-1~6, (1997)