| GISdevelopment.net ---> AARS ---> ACRS 1998 ---> Poster Session 2 |
The Basic Study of the
Maximum Logging Volume Estimation For Consideration of Forest Resources
Using Time Series FCD Model
A. Rikimaru, Y.Utsuki *, S.
Yamashita *
College of Engineering, Hosei University
3-7-2, Kajino-Cho Koganei-Shi, Tokyo 184, Japan
Tel: (81)-423-87-6115 , Fax : (81)-492-97-7414
E-mail : http://www.gisdevelopment.net/aars/acrs/1998/ps2/rikimaru@a1.mbn.or.jp
*Japan Overseas Forestry Consultants Association
Rinyuu-Blgd: 1-7-12 Koraku, Bunkyo-Ku, Tokyo 112, Japan
Tel: (81)-3-5689-3435 , Fax : (81)-3-5689-3439
E-mail: jofca@alpha-web.or.jp
AbstractCollege of Engineering, Hosei University
3-7-2, Kajino-Cho Koganei-Shi, Tokyo 184, Japan
Tel: (81)-423-87-6115 , Fax : (81)-492-97-7414
E-mail : http://www.gisdevelopment.net/aars/acrs/1998/ps2/rikimaru@a1.mbn.or.jp
*Japan Overseas Forestry Consultants Association
Rinyuu-Blgd: 1-7-12 Koraku, Bunkyo-Ku, Tokyo 112, Japan
Tel: (81)-3-5689-3435 , Fax : (81)-3-5689-3439
E-mail: jofca@alpha-web.or.jp
The forestry resources are growing up year by year in healthy natural condition. The FCD mapping model is enable to estimate the forest canopy density (FCD) which is one of the parameter of the forest resources. The time series analysis of FCD model lead the forest growth model. The growth model is enable to estimate the forest age and growth phase. These parameters are correlated with the forest volume and Sustainable growth condition. This study is discussed about the basic study to estimate the yearly growth volume of the forest resources, in quantitatively. The limitation volume of logging activities in each year must be smaller than yearly growth value to keep the sustainable forest resources. The basic methodology to estimate the yearly growth volume was developed by this study. The source RS data is LANDSAT-TM and project fields are Bago Yoma forests in Myanmar.
1. Introduction
Forest canopy Density (FCD) mapping is enabled to use 'FCD Mapping Model' which was already reported at 17th ACRS, 1997 (Rikimaru 1997)* by the authors. The accuracy of the FCD map has more than 80 ~ 90 % in the check points. This study is interim report of the applied or advance approach of FCD mapping to the use the forest management information. FCD volume has correlation to the timber volume. Both two parameter has high correlation to the forest age. FCD growth volume and forest timber growth volume are connected by forest age value in this study.
2.Study Area and Source Data
Study areas are Bago Yoma model forest in Myanmar. The main species area natural and plantation of the teak. The source materials of remote sensing analysis are time series LANDSAT-TM data. The data location is Path 113 Row 047. Observed dates are 1990.Oct.26 and 1994.Nov.6. The season of observation time is just finished the rainy season. The trees have fresh green leaves yet.
3. Methodology and Process
The out lines of analysis are shown in fig.1. There were prepared the FCD maps of '90 and '94. FCD growth model was analyzed by regression from '90-FCD to '94-FCD. Timber Volume was estimated by model integration of the three components; as FCD growth, forest age and timber volume. Present phase was analyzed in study.
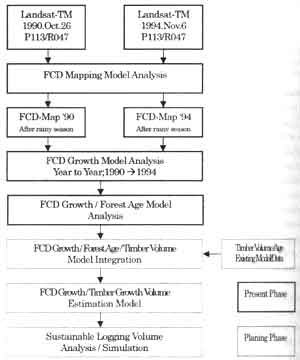
Fig.1 Flow chart of analysis
Fig.2 shows FCD growth modeling analysis. The curve of fig.2 shows the results of regression analysis. This regression function leads the characteristics of growth speeds in each FCD ranges. In this analysis, decreasing area of FCD were rejected. The threshold of rejection is five percentage decreasing area in FCD value from 1990 to 1994. The original FCD map 94 data and estimated FCD map 94 data has some difference. The difference values are corresponding to the logging volume from 19990 to 1994. These rate was shown in /table 1. FCD map 1990 and FCD map 1994- are shown in Image-1 and Image-2. Estimated FCD map 1994 is shown in IMAGE-3. Image-4 shows the difference of Image-3 minus Image-1. It's means that natural growth condition without logging. The Fig.2 regression function can lead the four year's growth characteristics in each FCD range. FCD growth curve in forest age (Fig.30 is transformed by the regression function (Fig.2) in every four year intervals. Fig.4 shows the growth speed in every four year of forest age. The forest age and timber growth, forest growth volumes have high correlation. The integration modeling of FCD growth, forest age and timber growth volume will estimate the sustainable logging volume in next study phase.
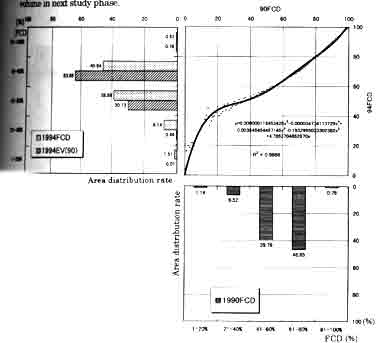
Fig.2 FCD Growth Model Analysis
| Range\Year | Distribution of FCD (%) | ||
| 90FCD | 94FCD | 94EV(90) | |
| 0% | 4.94 | 5.22 | 4.94 |
| 1-20% | 1.14 | 1.51 | 0.01 |
| 21-40% | 6.52 | 8.14 | 0.49 |
| 41-60% | 39.78 | 38.88 | 30.13 |
| 61-80% | 46.85 | 45.64 | 63.68 |
| 81-100% | 0.76 | 0.62 | 0.76 |
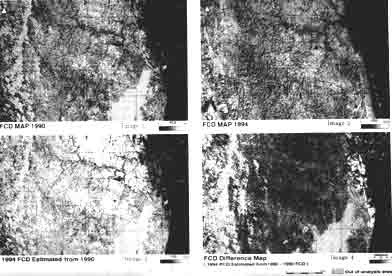
Results Map of FCD Analysis
4. Results and Discussion
FCD growth model analysis with forest age was developed in this study. This result are useful for classification of growth phase for each management area. For example, just growing up area and mature area are clearly classified by FCD growth curve (Fig.3, Fig.4).
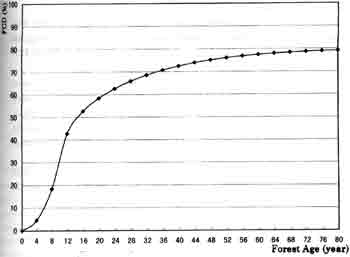
Fig.3 FCD Growth Curve in Forest Age
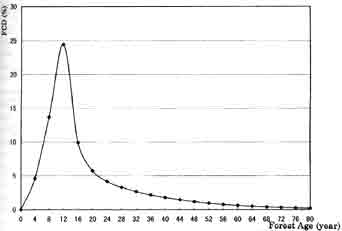
Fig.4 FCD Growth Difference Curve in every four year
It was found the possibility to estimate the forest timber volume from FCD map through forest age analysis timber volume. Both relations is not so simple structure. This study pointing that growing function from time series data, developed the extraction of forest age parameter systematically. This point is quite new advantage step and approach.
The selected test fields were just single species forests. This point was high advantage to set up the growth model. For the further, it must consider that the growth modeling of multi species forests.
References
- JOFCA. 1991. Classification system on logged-over forests. A workshop for the ITTO project PD 2/87 (F) Sub-project II. Rehabilitation of logged-over forest in Asia/Pacific region. Manila, Philippines, December 1991.
- JOFCA. 1993. Rehabilitation of logged-over forest in Asia/Pacific region, final report of Sub-project II. Prepared for ITTO. March 1993. Part II pp.1-41
- JOFCA. 1995. Proceedings of the workshop on utilization of remote sensing in site assessment and planning for rehabilitation of logged-over forest. Cisarua, Bogor, Indonesia, September 25-28, 1995.
- JOFCA. 1996. Proceedings of the workshop on utilization of remote sensing in site assessment and planning for rehabilitation of logged-over forest. Bangkok, Thailand, July 30- August 1,1996
- A.Rikimaru. 1996. LANDSAT TM Data processing Guide for Forest Canopy Density Mapping and Monitoring Model, ITTO workshop on utilization of remote sensing in site assessment and planning for rehabilitation of logged-over forests. Bangkok, Thailand, July 30-Agusut 1,1996. pp.1-8
- JOFCA. 1997. utilization of remote sensing in site assessment and planning for rehabilitation of logged-over forests. Project report on PD 32/93 Rev.2 (F) Rehabilitation of logged-over forests in Asia/Pacific region, Sub-project III. Prepared ITTO. January 1997.
- A.Rikimaru, S.Miyatake, 1997. Development of forest Canopy Mapping and Monitoring Model using Indices of Vegetation, Bare soil and Shadow. Proceeding of the 18th Asian Conference on Remote Sensing. Kuala Lumpur, Malaysia, 20-24 October, 1997.pp.E6.1-6
- P.S.Roy, A.Rikimaru, 1997. Biophysical Spectral Response Modeling Approach for forest Density Stratification, Proceeding of the 18th Asian Conference on Remote Sensing. Kuala Lumpur, Malaysia, 20-24 Ocober, 1997.ppE8.1-6
- Surachai, Supapis, A.Rikimaru, .1997, Thailand Eastern Forest Canopy Density Mapping and Monitoring Using Landsat TM Data. Proceeding of the 18th Asian Conference on Remote Sensing. Kuala Lumpur, Malaysia, 20-24 October, 1997,pp.JSB.1-6