| GISdevelopment.net ---> AARS ---> ACRS 1998 ---> Poster Session 2 |
Estimation of Annual Total
Nitrogen Load to lake from Basin with Remote Sensing
Kazuo Oki* , Yoshifumi
Yasuoka** and Minour Inamura*
*Gunma University, Department of Electric and Electronic Engineering,
Tennin-machi, 1-5-1 Kiryuu-shi, Gunmea 376-8515 Japan
Tel: +81-277-30-1784,Fax : +81-277-50-1780,
E-mail : oki@rs.el.gunma-u.ac.jp
**University of Tokyo, Institute of Tokyo, Institute of industrial Science,
Roppongi 7-21-1, Minato-ku, Tokyo 106-8558 Japan
Tel : +81-3-3402-6231, Fax : +81-3-3479-2762,
E-mail : mailto:%20yyasuoka@cc.iis.u-tokyo.ac.jp
Abstract*Gunma University, Department of Electric and Electronic Engineering,
Tennin-machi, 1-5-1 Kiryuu-shi, Gunmea 376-8515 Japan
Tel: +81-277-30-1784,Fax : +81-277-50-1780,
E-mail : oki@rs.el.gunma-u.ac.jp
**University of Tokyo, Institute of Tokyo, Institute of industrial Science,
Roppongi 7-21-1, Minato-ku, Tokyo 106-8558 Japan
Tel : +81-3-3402-6231, Fax : +81-3-3479-2762,
E-mail : mailto:%20yyasuoka@cc.iis.u-tokyo.ac.jp
In this study, a new method with remote sensing is proposed to evaluate total nitrogen load to la lake basin areas through rivers. In the method, following two parameters were evaluated from land cover distribution in the lake basin produced from LANDSAT MSS data and the nitrogen concentration measured at each river mouth to the lake;
- Basic units of total nitrogen load from different land cover categories
- Influent annual total nitrogen load to the lake.
1. Introduction
Land cover changes around lakes have caused serious environmental degradation in water areas. For example, the increase of nutrient load such as nitrogen and phosphorus to the lake due to land cover change in surrounding areas has been one of the major cause of water pollution or eutrophication. Monitoring influent nutrient load from the lake basin to the lake through rivers is now crucial in the management of lake environment. However, monitoring material flow from basin areas to lakes rivers is not easy because it requires spatial and temporal measurement tools for land cover distribution in lake basin areas and water qualities, and because it requires models relating them. Here, nitrogen is selected as a nutrient, and the model between land cover conditions and nitrogen load from the river basin areas is investigated.
Several methods have been proposed for the estimation of influent annual total nitrogen load to rivers and lakes based on the ground survey [e.g. Ibaraki Prefecture 1983]. Most of the conventional methods estimate influent annual total nitrogen load based on the sum of a basic unit of total influent load from each land cover category multiplied by each category area in the basin, and these methods could be applied only for the small basin areas because monitoring land cover conditions in a large extent of areas was not easy. Furthermore, the estimated values in these method usually differ much depending on the estimation methods, sites and seasons.
In this study, a remote sensing method was investigated to monitor land cover condition and changes in lake basin, and to analyze the relation between land cover and total amount of nutrient loaded to the lake through rivers. Lake Kasumigaura was selected as a test site.
2. Characteristic of Lake Kasumigaura Basin
2.1 Lake Kasumigaura and its Basin
Lake Kasumigaura is second largest lake in Japan with the water area of 220 square kilometers (Km2) and with the lake basin area of 2,135 Km2 . The lake is not so deep and the average water depth is about 4 meters (m) with the range of 0 - 7 m. the dominant land use category in the basin is agriculture including rice paddy, orchard, and it should be also noted that the hog raising (pig farming) is famous in the area which is a big point source of nitrogen load to the lake. For these thirty years urbanization and industrialization had been rapid along the railway, and the population has been increasing in the area.
Lake Kasumigaura is typical eutrophic lake and during summer season it is polluted by massive growth of blue green algae. It is mainly caused by influent nutrient such as nitrogen and phosphorus from the lake basin to the lake through rivers. These nutrient are consumed ion different ways for different purpose, and the nutrient load from land to river basins differs significantly among different land cover categories. The objective of the study is to estimate the nitrogen load to the lake from individual land cover categories.
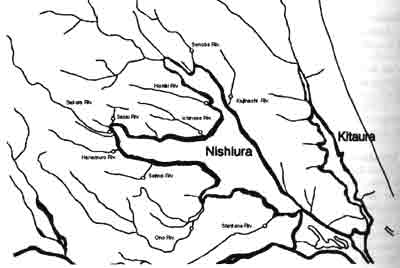
Fig.1 Lake Kasumigaura and its basin area.
2.2 Definition of Lake Basin and River Basin Area with DEM
In order to investigate the quantitative relation between the land cover condition in each river basin and the influent nitrogen, first, the lake basin area and the river basin area are defined using DEM in order to evaluate relation between influent nutrient lad and land cover type in the lake basin. The procedure to delineate the basin areas are as follows.
- Calculation of slope
- Search for non-sloe point
- Decision of individual river basins.
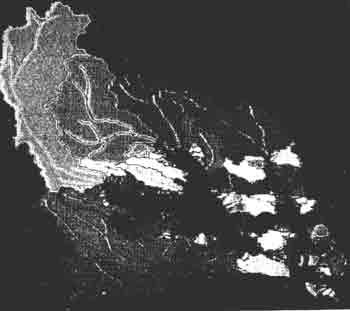
Fig.2 River basin of Lake Kasumigaura.
2.3 Land Cover Classification with LANDSAT MSS
LANDSAT MSS data from 1979, 1984 and 1990 were analyzed to produce a land cover distribution map in the Lake Kasumigaura basin and to evaluate land cover changes. Usually maximum likelihood method is utilized for classifying land cover, the method is not accurate enough to extract land cover changes if we don't have a good ground truth data for each year. In this study, the following procedure were used [Oki, et.al., 1996].
(1) Data compression:
Combined MSS data from 1979 and 1984 (or 1990) was compressed by the principal component analysis (PCA), and then the first to n-th PCA components were extracted which gives more than 9 % of cumulative variance.
(2) Unsupervised classification:
The basin areas were classified into more than twenty classes with the unsupervised classification scheme by ISODATA method from the compressed MSS data (n components).
(3) Production of land cover distribution map:
The classification results with unsupervised classification were re-merged into five predetermined categories include urban area, paddy field, forest area, water area and field which seem to give main impact for nitrogen load. Land cover distribution in 1979, we determined categories based on database provided by Ibaraki Prefecture in 1980. furthermore, in order to produce land cover distribution in 1984 or 1990, we considered land cover change in the basin and determined categories based on database investigated by field work. Figure 3 shows the classification result at the Lake Kasumigaura basin. Extent of each land cover category and the ratio of mixing categories in each river basin were estimated (fig.2 and 3).
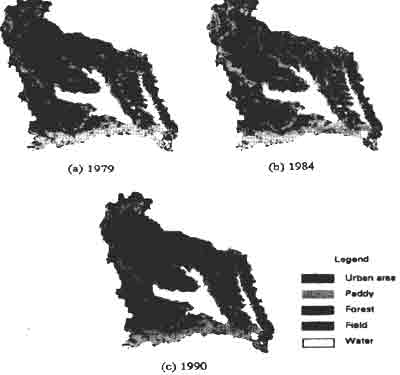
Fig.3 Classification of land cover at the Lake Kasumigaura basin
3. Estimation of Influent Annual Total Nitrogen Load
3.1 Data
In order to evaluate basic units of total nitrogen load from five land cover categories in the lake basin and influent annual total nitrogen load to the Lake, following data sets were collected in individual river basins were ten dominant river were selected.
(1) Annual mean total nitrogen concentration, N[mg/l]:
The annual mean total nitrogen concentration were calculated based on the data base provided by Ibaraki Prefecture. The each total nitrogen concentration in individual river basins were measured at the circle shown in Fig. 1.
(2) Annual precipitation, P[mm]:
The annual precipitation was estimated from meteorological report.
(3) Annual river discharge, Q[m3]:
The annual river discharge for each river was estimated from annual precipitation and run-off ratio of each river basin.
(4) Influent annual total nitrogen load to the lake, L[Kg/y]:
The influent annual total nitrogen load L was calculated as
L = N * 10-3 X Q
(5) Lake basin area, A[Km2], land cover area of each category, A'[Km2], land cover ratio of each category, r:
These data were calculated from land cover distribution map obtained in Chapter 2.
3.2 Basic Unit of Total Nitrogen Load from Each Land Cover Category
In order to estimate a basic unit of total nitrogen load from each cover category, influent annual total nitrogen load from each river I to the lake is defined by
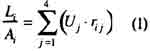
Where j (1-4) represent the suffix for each land cover category, urban area, paddy fields, forest area and field, respectively. U[Kg/Km2 * y] is named runoff load factor of total nitrogen in this study, which is a basic unit of total nitrogen load including run-off ratio from point or nonpoint sources to river mouth. Also, we assumed as follows in the Eq.(1) ;
Assumption 1: The pollutant load from point sources such as residual and industrial wastewater are included in the load from the urban area in the Eq.(1).
Assumption 2: The pollutant load from point source such as wastewater of livestock farming are included in the load from the paddy field and field (farm area) in the Eq.(1).
The Eq.(1) can describe the pollutant load from point and nonpoint sources by introducing runoff load factor of land cover categories for the large area such as lake basin area.
To estimate the unknown parameters, runoff load factor of total nitrogen Uj each land cover category, the following loss function E was minimized.
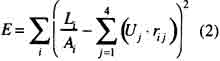
Figure 4 shows the estimated runoff load factor of total nitrogen. From fig.4, it was found that the runoff load factor of total nitrogen of the urban area and field are larger than those of forest area and paddy field. As a result, the extension of urban area and field give influence to the eutrophication of Lake Kasumigaura through the increase of nitrogen load to the lake area.
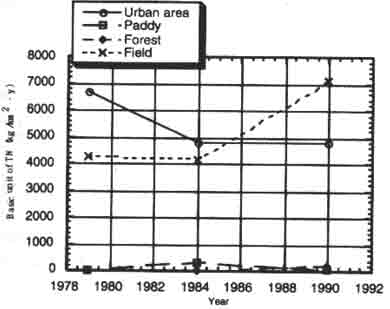
Fig.4 Runoff load factor (basic load unit) of total nitrogen
3.3 Estimation of Influent Annual Total Nitrogen Load to Lake Kasumigaura
In order to estimate influent annual total anitrogen load from Lake Kasumigaura basin to the lake, we calculated the load L as follows,
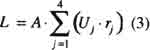
where A is Lake Kasumigaura basin area. U and r are estimated runoff load factor of each land cover category and the each land cover ratio in the Lake Kasumigaura basin, repectively.
Figure 5 shows the calculated influent annual total nitrogen load of each year from Lake Kasumigaura basin. And also, influent annual total nitrogen load calculated by Ibaraki Prefecture is shown in Fig.5 to compare with our method. The calculation of Ibaraki Prefecture is most popular method based on sum of a basic unit of total nitrogen load of each land cover category. As shown in Fig.5, it is found that result estimated by proposed method agree approximately with that of Ibaraki Prefecture method. However, the load estimated by proposed method decrease when the precipitation decreased in 1984, but the load estimated by Ibaraki Prefecture were always constant. It is because the effect of annual precipitation is considered in our proposed method. Therefore, this proposed method is effective in estimating influent annual nitrogen load to lake.
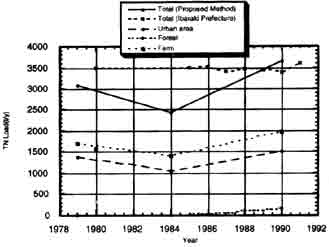
Fig.5 Calculated influent annual total nitrogen load of each year.
4. Conclusions
In this study, a new remote sensing method was proposed to valuate total nitrogen load to the Lake Kasumigaura. In the method, following two parameters were evaluated from land cover distribution produced by LANDSAT MSS data and the nitrogen concentration measured at each river mouth to the lake;
(1) A basic unit of total nitrogen load from each land cover category
(2) Influent annual total nitrogen load to the lake.
A nitrogen load model which relates total nitrogen load with land cover condition was investigated and two parameters were estimated with optimization method. The estimated result shows good agreement with the ground observation data.
Nutrient load to river and lakes is one of the essential factor polluting water quality, therefore, quantitative estimation of the load to water areas is indispensable for the improvement of aquatic environment. A remote sensing method investigated here may provide an efficient tool for the management of regional environment including land and inland water areas.
References
- Ibaraki Prefecture [1983]: the report of Eutrophication at the Lake Kasumigaura. Oki, K and Yasuoka, Y [1996]: Quantitative analysis of the relation between water quality of rivers and land cover distribution at the lake basin, Proceedings of the 20th JCRS, pp.65-66.