| GISdevelopment.net ---> AARS ---> ACRS 1998 ---> Poster Session 2 |
Using nighttime DMSP/OLS
images of Citylights to Estimate District-level Population Distribution in
Developing Countries
Takahiro Konami, Roysouke
Shibasaki, and Guoxin Tan
Center for Spatial information Science, University of Tokyo
7-22-1, Roppongi, Minato-Ku Tokyo 106, Japan
Tel: (81)-3-3402-6231 Fax(81)- 3-3479-2763
E-mail: konami@skl.iis.u-tokyo.ac.jp
Abstract Center for Spatial information Science, University of Tokyo
7-22-1, Roppongi, Minato-Ku Tokyo 106, Japan
Tel: (81)-3-3402-6231 Fax(81)- 3-3479-2763
E-mail: konami@skl.iis.u-tokyo.ac.jp
With the world having a population of more than 6 million . it is important for us to forecast future populating of the earth, especially in the developing countries which face a populating explosion. To forecast future population , it is necessary to grasp the fluctuation of district-level changes in population frequently and globally. In this research, a model was developed which yields district-level population distribution based on an input of DMSP/OLS images of night-time city lights. the existing detailed population distribution data of china was used to estimate the parameters of the model.
1. Introduction
Under the situation of exploding population on the earth, it is necessary to recognized the present situation of population distribution of the world in order to be able to estimate the future situation correctly. For this purpose one of the most important issues is to develop a method t grasp in detail the distribution of population , especially in the developing countries.
To see detailed transition of population distribution, It is desirable to have population distribution data by grid cells, but in developing counties such detailed statistics of population is not yet available.
As a consequence of these situations, the final purpose of this research is to develop a method to estimate detailed population distribution from data that can be obtained remotely, by observations from the space. To achieve this, the purpose of this paper is to explore a relationship between stable night light data generated by National Oceanic and Atmospheric Administration's National Administration's National Geophysical Data Center (NOAA/NGDC), and population distribution, which can be obtained form governments. The study area for this research is the People's Republic of china, as detailed population statistics is available in China, which is the largest one among developing countries.
2. Overview of the research
2.1. Source of the data
Stable night light data was obtained as a prototype " city light" data set form NOVAA/NGDC using the Defense Meteorological Satellite Program's Operational Line-scan system (DMSP/OLS). This data shows a cumulative percentage of lighted area for each pixel, of size 2.7 X km X 2.7 km. (Fig. 1-1).

Fig.1-1 Distribution of Night-Light Around China
When using DMSP/OLS data, thresholding has to be applied because of the very high in the OLS nighttime photo-multiplier configuration . Unless thresholding is done, OLS night-time light data may contain fisher's lights or other lights which have no relation to the inhabitants in that place. Thresholding cab eliminate such lights, which has no population.
As for the population data in the analysis, the author used " China Country -Level Data on Population (CENSUS) and Agriculture " which includes 1990 censes and agricultural economic variables at he county level for the People's Republic of China ( Fig.1.2). and the authors used 1:1 M GIS map as the boundary data of the counties in china . this data was developed by china in Time and Space (CITAS) Project Funded by Center for International Earth Science Information Network .
2.2 Overview of the analysis
As we mentioned above , the purpose of this research is to propose a method to estimate population distribution of China using DMSP/OLS night-light images .
In this research , the authors have tried to construct amodel, which can estimate county-level population from the night-light images.
To make such model, firstly the authors have assumed some models between population and night-light rate of each cell. After that , the authors have evaluated the accuracy of the assumed models by checking the output of them with the aggregated county-level population data . then, the best-fit model cab be found by comparing correlation values between output of the models and the actual population data .
Parameter that should be estimated are
(i)parameter of the initial model conditions that explain the relations between night-light and population of each grid cell , and (ii) appropriate thresholding rate for the night-light data to eliminate non-populated lights .
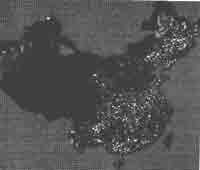
Fig.1-2 Distribution of Population of China from the Census
In summary, the procedure of the analysis is as follows.
- make models with unknown parameter between night light rate and population in each grid cell.
- set thresholding rate under which the night-light rat is ignored.
- Estimate parameters of the model by minimizing square of he errors between the estimated populations and the actual ones .
- Find the best threshold rate, which can be maximize the correlation between estimated and actual population .
- Compare the models to find the best model.
(a) liner models
P=aX+b
(b) exponential model
P= aXb
In this research , these models were applied for (1) whole of China, and for (2) every province of China. The following sections will explain the results of estimations of based on these models.
3. Results of the Linear Models Estimation
3.1. Result of the linear model applied to whole of China
At first, the authors hafe estimated a linear model for whole China. Fig. 3-1 shows the correlation value of the estimated models with various thresholding rates. Form fig.3-1, it can be said that thresholding rate should be between 5 and 36% to make better estimation.
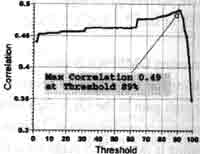
Fig.3-1 Linear model applied to whole of China
However, the maximum correlation value obtained is 0.49 and shows that the model is not practical when applying it to the whole of China to estimate the parameters.
3.2 Results of the linear model estimation applied to teach province
(1) Model fitness
we now apply the linear model to each one of the provinces of China. Fig.3-2 shows the correlation values of the model estimation versus the census population of each county. Every value is calculated with the best thresholding rate applicable for that province.
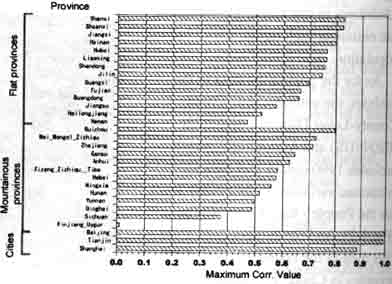
Fig.3-2 Maximum Correlation Value of each province (Linear Model)
Values vary with provinces. To find the reason or these difference , the authors have grouped all the provinces into -(i) 3 large cities ( Beijing , Tianjin, Shanghai) and (ii) other provinces . furthermore, the second group was sub-divided into (ii-a) flat provinces , and (ii-b) Mountainous provinces.
This classification cab be summarized as follows:
(i) 3 large cities
(ii) other provinces
(ii-b) Mountainous provinces
In turn , fig.3-2 also implies that accuracy of the linear model is better when it is applied to flat provinces and les applicable to mountainous provinces.
Fig. 3-3 to 3-5 shoes the detailed relationship between estimated and census population of counties of a large city ( Beijing ), a flat province ( shandong ), and a mountainous province ( Ningxia ) . the preceding argument cab; be also seen in these figures .
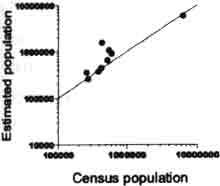 Fig.3-3 Linear Model fitness on Beijing |
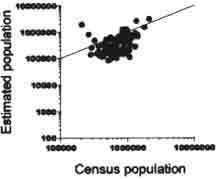 Fig.3-4 Linear Model fitness on Shandong |
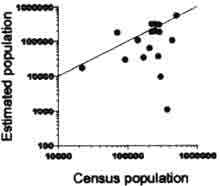 Fig.3-5 Linear Model fitness on Ningxia |
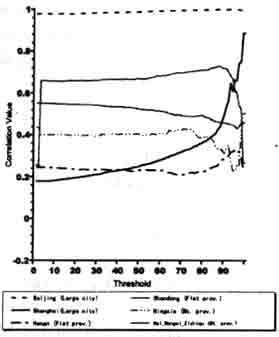
Fig.3-6 Correlation Values with the threshold (Linear Model)
(2) Effects of Thresholding rate
Fig. 3-6 shows the change of fitness in the linear model with various thresholding rates for several provinces . for most provinces, the thresholding rate has no strong relations with the fitness of the linear model.
4. Result of the Exponential Model Estimation
4.1 Result of the exponential models applied to whole of China
Fig . 4.1 is the result of the estimation from the exp9onential model considering whole China as one district . From Fig .4-1, the best thresholding rate is around 89% to Assume population distribution
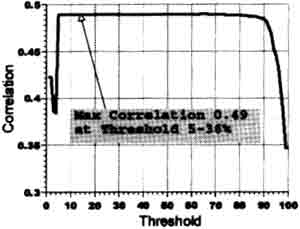
Fig.4-1 Exponential model applied to whole of China
However, like the case of linear model, the correlation value is too low to estimate detailed population distributin applying this model. It is also necessary to establish different models for each province.
4.2 Result of exponential model applied to each province
(1) Model fitness
Fig.4-2 shows the maximum correlation values of the models as a result of applying exponential model for each province. All provinces were classified to the same categories as in the preceding section.
In fig.4-2, the same tendency as in the former chapter was observed in every group. That is, exponential model fitness for large cities are better than those for other provinces . And, among non-city provinces , this model is over applicable for flat provinces than for mountainous ones.
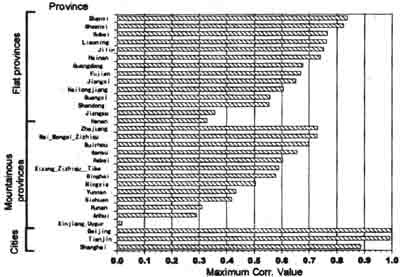
Fig.4-2 Maximum Correlation Value of each province (Exponential Model)
Fig.4-3 to 4-5 shows detailed fitness of the model for the same provinces as in the former section ; Beijing as a large city, shandong as a flat province , and Ningxia as a mountainous province.
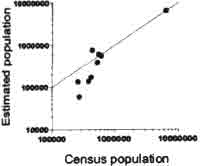 Fig.4-3 Exponential Model fitness on Beijing |
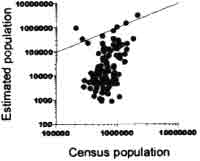 Fig.4-4 Exponential Model fitness on Shandong |
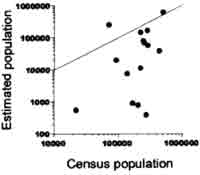 Fig.4-5 Exponential Model fitness on Ningxia |
(2) Effects of Thresholding rate
Fig.4-6 shows the change of fitness of the is model when the thresholding rate varies for few provinces . it can also be observed that the thresholding rate has no strong effects on model fitness using exponential model .
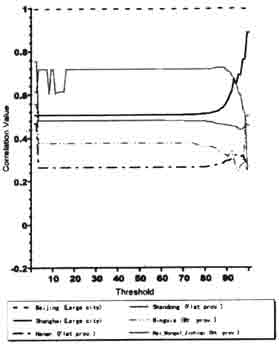
Fig.4-6 Correlation Value with the threshold (Exponential Model)
5. Conclusion and Further research
5.1Conclusion of the analysis
Based on the results of the analysis , the following facts can be concluded on t relationships between night time lights and populations distribution in China.
- Neither the linear model nor the exponential model can be satisfactorily applied to establish only one model for whole of China .
- Both linear ad exponential models can represent the population distribution of large cities in China satisfactorily .
- Both models show better fitness on flat province rather than that on mountainous provinces.
To achieve the final purpose of this research , the estimation ability of the model should be improved . for the purpose of this , it is necessary to try to establish a model considering other attributes of the pixels, such as the elevation, vegetation, etc….
To find the key to the new parameters , it should be important t study the reason for the differences in t fitness of the models, which was observed in this research.
Acknowledgement
This research is funded by "Research for the future " Program of Japan society for Promotion of Science .
References :
- Marc L. Imhoff et.al, A Technique for using Composite DMSP/OLS " City Lights " Satellite Data to Map Urban Area , Remote Sens . Environ, 61:pp.361 (1997)
- Paul Suton et.al., A Comparison of Nighttime Satellite Imagery and Population Density for the continental United States , PE&RS 63,11:pp.1303 (1997)
- Mikiyasu NAKAYAMA , Developing Population Database with DMSP/OLS Imagery, Proceedings of International Conference on modeling Geographical and Environmental System with Geographical Information System.