| GISdevelopment.net ---> AARS ---> ACRS 1998 ---> Poster Session 2 |
A Study of a Framework of
Integration of Heterogeneous Spatio-Temporal Data
Yoshihide Sekimoto and
Ryosuke Shbasaki
Center for Spatial Information Science, Institute of Industrial Science
University of Tokyo
7-22-1, Roppongi, Minato-ku, Tokyo 106-8558, Japan
Tel: (81) -3-3402-6231 ex: (2562) ,Fax : (81)-3-3408-8268
E-mail : sekimoto@skl.iis.u-tokyo.ac.jp
Abstract Center for Spatial Information Science, Institute of Industrial Science
University of Tokyo
7-22-1, Roppongi, Minato-ku, Tokyo 106-8558, Japan
Tel: (81) -3-3402-6231 ex: (2562) ,Fax : (81)-3-3408-8268
E-mail : sekimoto@skl.iis.u-tokyo.ac.jp
Recently many kinds of spatio-temporal data are repeatedly acquired for almost the same objects because of the recent rapid progress of data acquisition technology . we can raise various maps and remote sensing data of the same area as examples . These are heterogeneous spatio-temporal data. Some specific data integration problem has several solutions such as map overlay and fusion of the remote sensing data through all of them are note very satisfactory. However , we need to develop a generalized method of data integration based on each solution. This is because to will be expected to deal with an enormous and heterogeneous data in order t meet much higher demands such as monitoring of the complicated dynamics of a city. This study proposes a theoretical framework to integrate data of the object measured by different conditions, together with information to be provided, such as metadata in applying integration method.
1. Introduction
Recently many kinds of spatio-temporal data are repeatedly acquired for almost the same objects because of the recent t rapid progress of data acquisition technology. We cab raise an example of NOAA AVHRR data an Landsat TM data as heterogeneous -----different resolution , band and observation time--- remote sensing data of the same area. Spatial aspects of the heterogeneity are some gaps in the map boundaries, differences in resolution and geocoding gaps in remote sensing data and so forth . temporal components examples are the data observation time and acquisition time and acquisition time. Users , surrounded by may kinds of spatio-temporal data , according to their own demands, cannot help selecting either of a may data or just overlaying many data such as "rubber sheet method ". In the former case using single data it may not satisfy the various demands of users, while in the later case simple overlay of heterogeneous data may create meaningless information. This leads t the problem that we can not make effective use of many kinds of data . in this situation NSDI (National Spatial Data Infrastructure ) plan, which aims at the common sharing of information, is now under ways a governmental policy and it will creator a demand to integrate a wider variety of heterogeneous spatio-temporal data. Although specific cases of data integration may have several solutions like map overlay we need to develop a more generalized method of data integration . this is because it will be expected to deal with an enormous and heterogeneous data in order to meet much higher demands such as monitoring of the complicated aspect of a dynamics city. The objective of this study is therefore to show a theoretical , methodological framework of integrating data of an object from multi sources to estimate the status of the object, together with essential information like metadata provided in applying this methodology. Further more we show that were place the existing ad hoc methods in the framework and a proposed generalized method can be applied to more complicated case.
2. An example of map overlay as a process of data integration
In this chapter we briefly describe flow of the data integration through an example of map overlay to identify importance components in the data integration process. We assume that a use needs to estimate more accurate Cho-Co-Moku (CCM: lowest level of administrative zones ) boundary in Sinjku Ward by overlaying two boundary maps, Spatial Data Infrastructure (Digital Map 2500) by GSI (Geographical Survey Institute )a n Census Mapping System (CMS) data by Statistics Bureau of Japan.
2.1 Retrieval ad acquisition of observational data suitable for demand of users
User's need is to know more accurate boundary of CCM so as to get some suitable data form database, and SDI and CMS are chosen as suitable "observational " data by referring each metadata. But some gaps may be seen between boundary line features in these maps. W have to determine which lines should be merged considering the why the errors and gaps occur. Figure 1 shows that the sources of the gaps are generally divided into three steps .
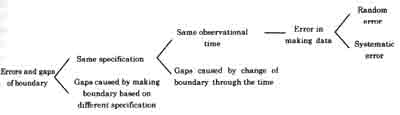
Fig.1 Sources of errors and gaps
2.2 Classification of the observational data CCM
in this study, existing map data is regarded as "observational " data. We have to find out reasons of the gaps between " two kinds of CCM boundaries . if two types of CCCM boundaries data defined are generated based on different product specifications, it is necessary to determine how much degree they are close with each other, i.e. which part of the boundary data (observational data ) should be matched, because they are obtained from identical objects in real world, and which part should not because they are from different objectives. In case CCM boundary of CMS, which is also called regional statistic boundary consists of census tracts including some base unit tracts, while SDI consists of streets blocks, this is why gaps of CCM objects exist ( figure 2.). but it can be said that both are based on the same product specification if we cab trace back to the base unit blocks and street tracts because based unit tracts is equivalent to streets blocks in CMS data.
Even if specifications are same we need to consider a gap by change of object through the time. In this case imagine that town boundary was changed in certain time ad that the name of town was changed . this means the change of location and attributes of boundary through the time. If we take a gap of objects by different observation time onto account, an error in determining the location only remains. The locational error can be classified as a systematic error and a random error.
Like this , we cab overlay base unit tracts and street blocks as observational data from the commonly defined objects if we identify objects as CCM and regional statistic boundary referring each metadata.
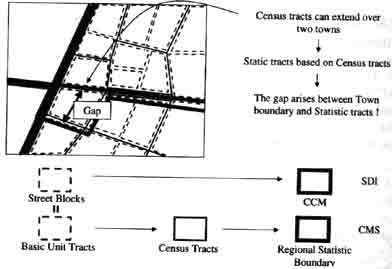
Fig.2 Gaps between boundary data generated "partially" different product specification
2.3 Estimation of the CCM Boundaries
After the identification of observational data from the same objects we cab estimate the location , shape and an attribute of the object from base unit tracts data and street blocks data. We have only to take into consideration an error in measuring location and spatial extent of objects . taking an error and reliability into consideration by referring by referring to the quality of data described in metadata, we cab determine a probabilistic distribution for locatinal uncertainties of the boundary lines. Using the probabilistic function we can merge the boundary observational data to estimate the location boundary from by applying maximum likelihood method or some others . estimation accuracy cab be improved by considering constraints , which come form the shapes and nature of object itself, in addition to the observed data. It is necessary to prepare feature catalogue in advance including general information about feature as constraints.
3. framework of data integration
This section describes a framework of data integration. We define object as a thing , the state and changes of which we want to now by data integration, and define observational data as data to be integrated. According to the definition existing maps are also observational data.
3.1 Preparations
we summarize conditions used in classification before integration because process of data integration changes according to the nature of objects and observational data.
- Type of object
(a) discrete distribution object (B) continuous distribution object - Types of observational data
(A) Classified observational data (B) Unclassified observational data - Dynamic nature of object
(A) immobile object (B) Mobile object - Data form
(A) Vector data (B) Raster data (C) Mixed data
There are two types of object ; discrete distribution object has a finite spatial extent or crisp boundaries,. While continuous distribution object has an infinite spatially continuous distribution such s temperature distribution . the essentials difference between these two is a definition of spatial extent. Spatial extent of a discrete distribution object is determined naturally when the object itself is defined, whereas the definition of continuous distribution object cab be made ind4pendently form the definition of aggregation and sampling unit, which is indispensable to generate data.
3.1.2 Types of observational data
Types of observational data depend on whether observational data is clearly classified to some object. For instance map data is observational data which acre already classified or attached to each object =. On the other hand each pixel in image data of remote sensing is not clearly classified to each object
3.1.3 Dynamic nature of objects.
It is necessary to classify in advance whether object changes through the time r not if we consider the temporal changes in object identification. This means that mobile object, whose shape and location changes every moment , is not applicable for identification of object as it is, though immobile object unchangeable through the time cab be used as the key of data integration object is known as unchangeable
3.1.4 Representation form of data
Representation form of data, which has no essential difference between raster and vector data , affects a design for algorithm of data integration .
3.2 Framework of data integration
We will show framework of data integration based on the preparation in previous chapter. The framework consist of three steps:
- Retrieval and acquisition of the observational data
- extraction of observational data on the object
- Estimation of the state/dynamics of the object from observational data
This is a process of retrieval and acquisition of observational data, which may relate to an object requested by a user, form existing various data set by referring to its quality and product specification by way of each metadata. We can raise some examples of criteria ofr4 retrieval and acquisition .
- Distance of hierarchy along hierarchy of object definition ( for all objects
- Distance of concept ( for all objects )
- Distance in space and time ( especially for continuous distribution object ).
We classify observational data,. Collected as data related to the object into two types: one is data obtained room observing the object. The other is not from the object. For example, map data is observational data already classified. However, even fro the map data this process is needed, because it might happen that object definition used in ht classification differs from that used by users. The classification method is basically a test of hypo9thesis whether the observational data is data on the object or not. The measure , which shows the "degree" that observational data is observed from object, is a probability of observation executed and a error generated by observation. These processes of classification enable us to extract observational data of object.
3.2.3 Estimation of the state/dynamics of the object from the observational data
We estimate location, shape , vector of motion, and an attribute of object using classified observational data in 3.2.2 . first we set a function of object that consists of and attribute of object and coordinates of point s representing a shape of object : The function is [ (xi (t), yi(t) (I=1,2,…..,N)+Attribute (t) ] . in the next stage we assume each data have error and reliability by referring to its quality. For example features such as line can have probabilistic distribution . And moreover, estimation reliability can be improved by considering the constraints, which come form the shape and nature of object itself , in addition to the observational data. E can obtain constraints referring to the feature catalogue prepared in advance. Under these preparation we can estimate object from some data by statistical method.
3.3 Information needed for data integration
As considered before, we refer to many kinds of information in each step of data integration. They are classified below:
- Information about product specification of data
- Information about data (metadata)
- Information about feature catalogue
Product specification of data may include definition of object describing criteria which data should satisfy, required accuracy of location, shape , an attribute, name of feature cataloguer to be referred and source of information to be referred. Product specification is accessed by way of metadata.
3.3.2 Information about data (metadata )
Metadata should contain the information on quality of data such s accuracy of location, shape and classification
3.3.3 Information about feature catalogue
Feature catalogue, which is accessed by way of metadata, consists of feature catalogue peculiar to product specification and common feature catalogue. It is expected that these be arranged as a part of NSDI.
4. Future Perspectives
We propose a framework of spatio-temporal data integration, therefore methods of each step should be developed. First we plan to focus on the case of immobile .
Reference:
- Kadowaki, T., and shiibasaki, R., 1992, Measurement and evaluation of location error of line data on digital map. Proceeding of the symposium of the Japan Society of Photogrammetry and Remote Sensing, 1992, pp.71-76.