| GISdevelopment.net ---> AARS ---> ACRS 1998 ---> Poster Session 2 |
Correction of time series
NDVI by the method of Temporal Window Operation (TWO)
Jonggeol Park and Ryutaro
Tateishi
Center for Environmental Remote sensing, University of chiba
1-33, Yayoicho, inage-ku Chiba 263, Japan
Tel: (81)-43-290-3850 Fax: (81)-43-290-3857
E-mail : amon@rsirc.cr.chiba-u.ac.jp
AbstractCenter for Environmental Remote sensing, University of chiba
1-33, Yayoicho, inage-ku Chiba 263, Japan
Tel: (81)-43-290-3850 Fax: (81)-43-290-3857
E-mail : amon@rsirc.cr.chiba-u.ac.jp
The method to correct time series of NOAA-AVHRR data be used for global land cover monitoring is developed in this study. Most of study used NDVI time series from AVHRR for land cover monitoring. But the value of NDVI decrease due to the effect of cloud and atmosphere. For reducing the effect, cloud-screen and Maximum Value Composite (MVC) are applied but cloud-screen algorithm needs ancillary data sets and MVC loses some part of information of seasonal changing by length of composite. Also, MVC leads a reason of classification error because using the maximum value as a typical of composite period. Therefore, we develop an algorithm to detect and remove cloud contamination and atmospheric effect using NDVI time series profile without ancillary data set for global land cover monitoring.
Introduction
Generally most of study used normalized difference vegetation index (NDVI) time series from Advance Very High Resolution Radiometer (AVHRR) for land cover monitoring. But the value of NDVI decreases due to the effect of cloud and atmosphere. Cloud cause serious problem in optical remote sensing of terrestrial ecosystems. To reduce the effect of cloud, composite techniques have been developed, most often using data from the AVHRR on board the NOAA satellites such as MVC, cloud-screening procedures, Maximum Value Interpolation (MVI). The MVC techniques permit the production of nominally cloud free image from individual, partly cloudy input scenes by selecting the most cloud0free pixel from the same geographical location from images taken over a limited period of time. The MVC method produces at least two errors: the first one, obvious and unavoidable, is the NDVI value for each month; the second one is the day assigned for this value, supposed to be the 16th of each month.
The problem addressed in this paper stems from the fact that in practice, such composite almost always contain some residual cloud- of cloud contamination pixels, representing areas that are cloudy on the available image. Since the remaining cloud lower the composite NDVI value, the area under the NDVI curve is thereby reduced. This decrease introduces errors in vegetation productivity estimation or assessments of photosynthetic activity of the vegetation based on the seasonal NDVI curve. A simple solution for removing residual cloud is to extend the composting period. But this method will lose the information of seasonal change of vegetation. Another possibility is the use of cloud-screening procedures on single image to identify and mask out the contaminated pixel. But cloud-screening techniques are more difficult to apply to land area because of high spatial heterogeneity and their sensitivity to seasonal and regional influences. They are also least for detecting cloud, subpixel cloud and cloud shadows.
J.Cihlar et al. proposed the procedure for detection and, if possible, removing the effect of residual cloud contamination from AVHRR composite image in Canada. But this technique is not good for global land cover study because of unknown the highest and lowest value of during the period.
The objective of this paper is to develop an algorithm to detect and remove cloud contamination and atmospheric effect using NDVI time series profile without ancillary data set for global land cover monitoring. The result showed that NDVI correction was improved by using MVC, MVI, Cloud screen and J.Cihlar method.
Profile extraction: Temporal Window Operation (TWO)
NDVI value can only decrease as a result of atmospheric attenuation, solar zenith angle (SZA) and cloud. Therefore, the "true" NDVI value for a vegetated surface during composting period can be assumed to be as high as, or higher than, the maximum NDVI value recorded for that pixel.
The proposed correction method employs several assumptions.
- NDVI values for a given pixel increase monotonically from the start point to first larger value point than start point value during fixed period (window size).
- NDVI values for a given pixel decrease monotonically form the start point to maximum value point, if there is not existed larger value than start point value during fixed period (window size).
- The true NDVI for a pixel during a given period is as high as of higher than the highest value measured during that period.

Fig.1 Correction of time series of NDVI by the method Temporal Window Operation (TWO)
Data
NDVI time series for thirteen years, from 1981 to 1994, were taken 10-day composite data NOAA/NASA pathfinder AVHRR Land Data Set. These data were calculated from the calibrated channel 1 and 2 data:
Where Rch1 and Rch2 represent top- of the atmosphere reflection of AVHRR channel 1 and 2, respectively. Each full composite image covered whole global land contained over 1.458 x 107 pixels.
Result
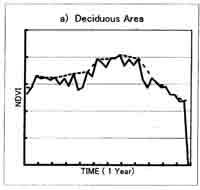
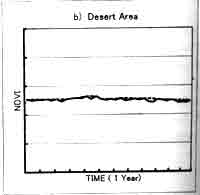
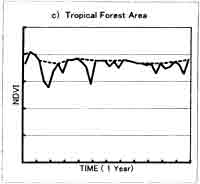
Two is sensitive to length of the window size; too short period will retain too much noise, while too long period will tend to smooth out important changes. Fig. 2. Shows the difference between original NDVI data when window size is 5 (every 5 10-day composite data). The result of this correction method is different depending on the window size. For the vegetation type shows that almost no change of NDVI profile through year, such as desert area and tropical forest area, the total vegetation biomass change can be big, the extraction of short-period vegetation change is difficult. The window size of 4-5 is appropriate for the two times planted area. For the area where there is a peak vegetation time in one year, like deciduous area, the window size of 5-6 is better. Usually for global vegetation research using 10-day composite data, the window size 4-5 is suitable.
 |
 |
 |
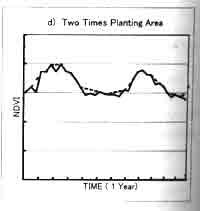 |
Fig 2. NDVI profile from AVHRR 10-day composite data : 10-day composite raw data and profile using the TWO method (window size=5), a) deciduous area , b) desert area , c) tropical forest area , d) two times planting area.
Comparison of the MVC, MVI and TWO techniques
The problem of the commonly used MVC to vegetation monitoring is that no matter how long the maximum value occurs in the composite period, it is assigned for the value of the 16th in each month. To solve this problem, the Maximum Value Interpolation (MVI) was proposed.