| GISdevelopment.net ---> AARS ---> ACRS 1998 ---> Poster Session 1 |
Coastal Erosion Modeling
using Remotely Sensed Data
Maged m.m. and s.b.
Mansor
Faculty of Engineering
University Putra Malaysia
43400 Serdang, Selangor
Fax : + 6-03-948 8939
shattri@eng.upm.edu.my
Abstract Faculty of Engineering
University Putra Malaysia
43400 Serdang, Selangor
Fax : + 6-03-948 8939
shattri@eng.upm.edu.my
Coastal erosion is caused by the input of the wave energy to the coastal zone. This wave energy could sedimentation or erosion along the coastline. One of the areas reported to experience this problem is the coastline of Kuala Terengganu. The aim of this study is to develop system to predict the coastal erosion. Mathematical model was carried out to investigate and predict the erosion. This model utilized several types of data, including remotely sensed data, ship observations and ground truth data. In this project, aerial photos and airborne AIRSAR/TOPSAR data were utilized to predict the coastal erosion. The main parameter extracted from the remotely sensed data were the remotely sensed data is the wave spectra density along the shoreling of Kuala Terengganu.
The results show that the shoreline of Kuala Terengganu is exposed to sedimentation and erosion at various locations. The probability distribution function model has been adapted to predict the shoreline changed utilizing ship observation data from 1971-1983. By integrating the wave spectra pattern derived from TOPSAR data with the wave spectra change derived from ship observation, the sedimentation and erosion in coastal water of Kuala Terengganu could be predicted. Statistical analysis shows that shoreline changes are in Equilibrium State with nature. The changes are usually temporary and would normally recover back to its original state.
The study indicates that coastal erosion occurred seasonally during the northeast monsoon period due to wave actions. However, the sedimentation was occurred during south-west monsoon period and during internal monsoon period.
Introduction
The applications of remote sensing data for coastal processes has a more interest between researchers. Most of the works used the historical data of aerial photo and satellite imageries to detect shoreline changes (Mazalan et al., 1989; frithy et al., 1995). The interest subject has been taken into account between researchers, which is the coastal sedimentation and erosion. A using remote sensing techniques to study coastal erosion will produce a wide concept for erosion problem. Because of the fact that remote sensing techniques able to figure out the interaction between sea and shoreline change. Furthermore, remote sensing techniques able to cover a large area over than 300 km. Recently radar imageries such as ERS-1 show ability for coastal studies. Ibrahim and Samsudin 1996; Maged et al., 1998 have done such studies. Most of studies conducted for coastal erosion problem either by classic methods (Lukman et al., 1995) or remote sensing data (Raj, 1982; Mazalan et al., 1989; Maged et al, 1997) could not predict coastal erosion over long time. The aim of this study is to predict the coastal erosion especially at long term. This will be done over one hundreds years period.
Methodology
Study Area
One of the area reported to experience rapid erosion is the coastline of Kula Terenggarnu. This area is exposed to highest wave during the north-east monsoon compare to south-west and transitional period (Wong 1981). The study area is located in the South China Sea between 5° 21'N to 5° 21'N and 103° 10' E. The highest rate of shoreline change reported in the study area was 30m/yr in the study of Mazlan (1989).
Wave Spectra Model
Wave spectra derived from the C-band AIRSAR by applying two dimensional Fourier Transform from PCI EASI/PACE image -processing system this. The wave spectra derived from C-band AIRSAR were map into the real wave spectra by using quasi-linear model.
Whee S (Q) is a quasi-linear transform function, Kx is wave number azimuth direction; Kc is the cut-off wavenumber, which function of wind speed. S(k) is AIRSAR wave spectra while S(L) is real wave spectra measured in situ.
Mathematical Model of shoreline Change
Mathematical model of shoreline changes is based on the rate changes of the sediment volume. Mathematical model utilized several types of data, including AIRSAR wave spectra; quasi-linear wave spectra; average ship observation data (1971-1983) and ground truth. This has been done by using ACESS 1.07 software.
Statistical Model
In order to predict the shoreline changes over one hundreds years or more, the probability distribution function of the different sources data was used. This was done under the following assumptions:
- Human activities was neglected
- The time interval between erosion and sedimentation events begin equaled or exceeded
- The shoreline change occurred seasonally.
- The shoreline change rate for different period are estimated from the following relation:
Where y is given by Weibull distrubiton
Where S is number of erosion and sedimentation events per year, T is return period (years) and k is the length of records by years. The probability of erosion and sedimentation occurrence could be expressed as a percentage change of occurrence. This could be given by the following
Where p is the chance of erosion and sedimentation occurrences and L is time. The model has been used to estimate return period of the wave percentage occurrence. In its study we have used the above model to predict shoreline change over one hundreds year.
Results
Wavenumber spectra peaks have different size and direction at different seasons. The range of wavenumber during the south-west monsoon was 0.22 rad/m to 0.4 rad/m whereas the wavenumber spectra during the north-east monsoon ranged from 0.12 rad/m to 0.22 rad/m. However, wavenumber spectra ranged from -0.13 to 0.2 rad/m during the transitional period. The wave spectra peaks normally change its directions from south-east to north-east during the north-east monsoon. However, waves may come from varies direction during the transitional period.
The wave spectra modeled from the truth data in 6 the December 1996 shows a north-east movement. The wavenumber ranged from 0.16 rd/m to 0.23 rad/m. The wave spectra derived from AIRSAR shows a shift in wave spectra peaks along the azimuth direction. This spectrum has wavenumber ranged from 0.2 rad/m to 0.38 rad/m. The wave spectra modeulation by quasi-linear transform shows the shift in direction and wavenumber in azimuth direction. The wave number ranged from 0.18 rad/m to 0.36 rad/m.
The shoreline change modeled from wave spectra data is shown in Figure 2. Figure 2a shows the shoreline change modeled from ship observation data and found to varies seasonally. During the north-east monsoon, the erosion events occurred in distance between 4000 m to 6000 m away from Kuala Terengganu River. The rate of erosion is ranged between -0.2 m to -4 m/yr. In comparison to south-west monsoon and transitional period, the sedimentation takes place over eroded region. The sedimentation ranged from 0.2 m to 2.5 m that is clear during south-west monsoon period. The rate of erosion found at
Sultan Mohamed airport is -1.4 5o 21'N m/y modeled from AIRSAR wave spectra. The rate of change modeled from truth data was decreased to -9.1 m/yr while the rates estimated from aerial photographic is less than -0.5m/yr. The maximum rate of sedimentation occurred at UPM beach with 1 m/yr modeled from AIRSAR wave spectra and wave truth data. The area. A comparison between different sources of data showed that erosion peaks and sedimentation peaks (Figure 2b) coincided with each other. Figure 3 shows that there is no exceeded in the change of shoreline applied over 100 years within probability of 0.97.
Discussion
A comparison between wave spectra modeled by truth data, AIRSAR and quasi-linear shows a different shape of spectra. This could be due to Doppler shift in azimuth direction as stated by Hasselman and Haselman, (1991); Vachon et al., (1994). The wave spectra modeled from ship observation during the north-earth monsoon. This is due to fact that the two data are taken in a difference period. According to Wong (1981) the waves moves from the southward during the south-west monsoon and move from north-east during the north-east. However, the waves have not fix direction during the transitional period. As matter of fact that a weak south-west wind still prevails and the wind in the process of changing its pattern (Maged et al., 1997). Therefore, the waves in this period had no fix direction as the wind was in the process of changing.
The erosion occurred the north-east monsoon compared to the other seasons. This id due to the wave energy is higher during the north-east monsoon and is proportional with square of wave height (Komar, 1976). This means that the waves are more destructive during the north-east monsoon. In addition the probability distribution function shows non change on the cycles of shoreline change. This means that the beaches are in an equilibrium state with the nature. Changes caused by the natural forces are usually temporary and beaches could normally recover back to their original state. This result conformed the finding from Wong (1981); Raj, (1982); Stanely et al., (1985); Masutra (1989); Lukman et al, (1995).
Conclusion
In conclusion, remotely sensed data showed a good integration with wave spectra model to detect shoreline change. The statistical model showed shoreline changes are in equilibrium state with nature. The changes are usually temporary and can normally recover back to its original state. The study indicates that coastal erosion occurred seasonally during the northeast monsoon period under wave actions. In contract, sedimentation occurred during south-west monsoon period and during the internal monsoon period.
Reference
- Ibrahim M.S. and A. Samaudin 1996. Assessment of ERS-1SAR Data for some Application in the Malaysian Coastal Zone. Proceeding of the First Malaysian Remote Sensing Society Conference on Remote Sensing and GIS.25-27 November 1996. Kuala Lumpur.
- Frithy O.E., S.M.Nasr, M.M.El Hatab and M.El Racy 1995, Remote sensing of Beach Erosion Along the Rosetta Promontary, Northwestrn Nile delta, Egypt.Int J.remote sensing : 15(8) pp.1649-1660.
- Haselman K.and Hasselman S. 1991. "on the Nonliear Mapping of an ocean Spectrum and Its Inversion". J geophys. Res.,96:(C6),pp.10,713-10,799.
- Komar ,P.D.1979.beach processes and sedimentation. Prentice-Hall, New Jersey.
- Lukman,M.H.Rosman and S.Sand 1995. " Beach Erosion Variability during a North-east Monsoon: The Kuala Setiu Coastine. Terengganu, Malaysia". J .Pertanika 3(2) pp.337-348.
- Maged ,M.M.,M.M Ibrahim and Z.Ibarhim 1997. ERS-1 AND Wave Refraction Modeling in the South China Sea. Paper Presented in International Marine Science Conference Assessment and Monitoring of Marine System. August 25-27.Primula Park Royal Beach Resort. Kuala Terenggenu. Malaysia.
- Masrtura,S.,1987.coastal Geomorphology of desaru and its Implication for costal Zone management. Monograph no.13.Bagi : University Kebangasan Malaysia.
- Mazlan , H.I. Aziz and a Abdullah 1989.Preliminary Evaluation of Photogrammetric-remote sensing Approach in Monitoring Shoreline Erosion Proceeding of the Tenth Asian Conference on Remote Sensing. November 23-29 1989. Kuala Lumpur, Malaysia.
- Raj,J.K 1982 Net Direction and Rates of Present-day Beach Sediment Transport by Littoral Drift along the East Coast of Peninsular Malaysia. Geol. Soc. Malaysia bull..1557-82
- Stanley consultants Inc.1985.Malaysia National Coastal Erosion Study.Vol II Kuala Lumpur: UPEN
- Vachon P.W.,K.E.Haroba and J.Scott 1994 Airborne and Space borne Synthetic Aperture Radar Observation of ocean waves. J.Atmo-ocean 32(10);83-112.
- Wong,P.P.1981 Beach change on a monsoon coast, Peninsular Malaysia J.Geol.Soc.Malaysia. 14:47-59.

Figure 1. wave Spectra Model (a) Truth data, AIRSAR and Quasi-linear (b) Ship Observation
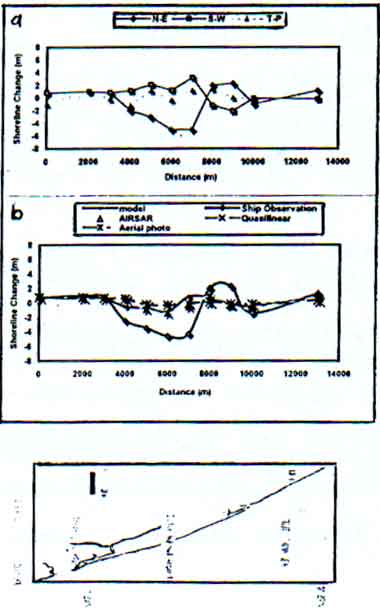
Figure 2. Shoreline Change Simulated from (a) Ship Observation (b)AIRSAR Aerial photo Wave Model and Quasi-linear Model.
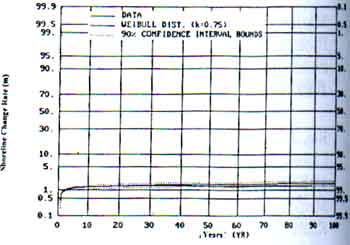
Figure 3 Shoreline Change predicted over 100 years